Over last week and these last 2 days in this week I posted measured answers to readers both in Twitter and Reddit who asked whether my experiments of 2 local agents on 1 Mac run in parallel or take turns. The answers was that they share one continuous batch, batching is real, and 3 quiet choices collapse it. I thought that was the end of it. It was not. The comments were better than my post, WHICH IS AWESOME, becaue this is the crowdsourcing of brain power I love. I not trying to be a KNOW IT ALL Im trying to be a LEARN IT ALL!
Notably 3 people did not argue with my findings, which is FAIR because the way i set up the experiment can certainly predjudice the findings. They handed me testable claims. So I did the only honest thing, which is to go measure their claims. This post is what the measurements said. Some of it confirmed the commenters. 1 part corrected me. And at the very end, a real agent handoff on my own machine walked straight into the wall these charts describe, which is the best kind of proof, because I did not stage it.
The Housekeeping Note
If you are new here, last month a post of mine got called AI slop on Reddit. My full answer, and the standard I now hold my own writing to, lives on its own page: On Slop, And Who Gets To Call It That. Every number below was measured on my own hardware with a load driver I wrote. Nothing here is estimated, and the run matrix is on disk. That is the whole point.
The 3 Claims I Was Handed
Credit where it is due. 3 commenters gave me the spine of this post.
Ok-Category2729 made the sharpest point. Decode, the token-by-token generation phase, is memory-bandwidth-bound. Every single token forces the machine to re-read the entire set of model weights out of memory. On my dev rig Macbook Pro M3 Max that is a fixed pool of bandwidth shared across everything. So adding a 2nd decode stream does not add a 2nd lane of speed. It splits the 1 lane you already had. His prediction was that 2 agents would land somewhere around 1 1/2 times a single agent, not 2 times.
ReleaseFlashy9582 asked the question that turns 1 chart into 3. Does prompt length change the answer? Short prompts and long prompts are not the same workload, because the prefill phase, where the model reads your prompt, behaves differently from the decode phase, where it writes the answer.
Thick_Ad1919 kept me honest on the framing, pushing on where the real bottleneck sits rather than letting me hand-wave it.
Those 3 claims map to 3 experiments. Here is what each one measured.
The Rig, In One Paragraph
Same approach as last time, because it is the only one that is fair. A human cannot start 2 agents at the same instant, so any hand-run test really measures my launch timing, not concurrency. Instead a small load driver holds every request at a barrier and releases all of them at the same microsecond, fires them at the live mlx_lm.server running Qwen 3.8 at four-bit, and records aggregate throughput, per-agent decode rate, and time to first token. For this post I ran a matrix of thirty-six loads: a concurrency sweep, a prefill-versus-decode split, and a prompt-length sweep, each repeated so I could take a median rather than trust a single noisy run. This is one machine, one model, one honest probe. It is not a datacenter benchmark, and I will not pretend it is.
Finding 1: The Second Agent Helps A Little. The Fourth Does Not.
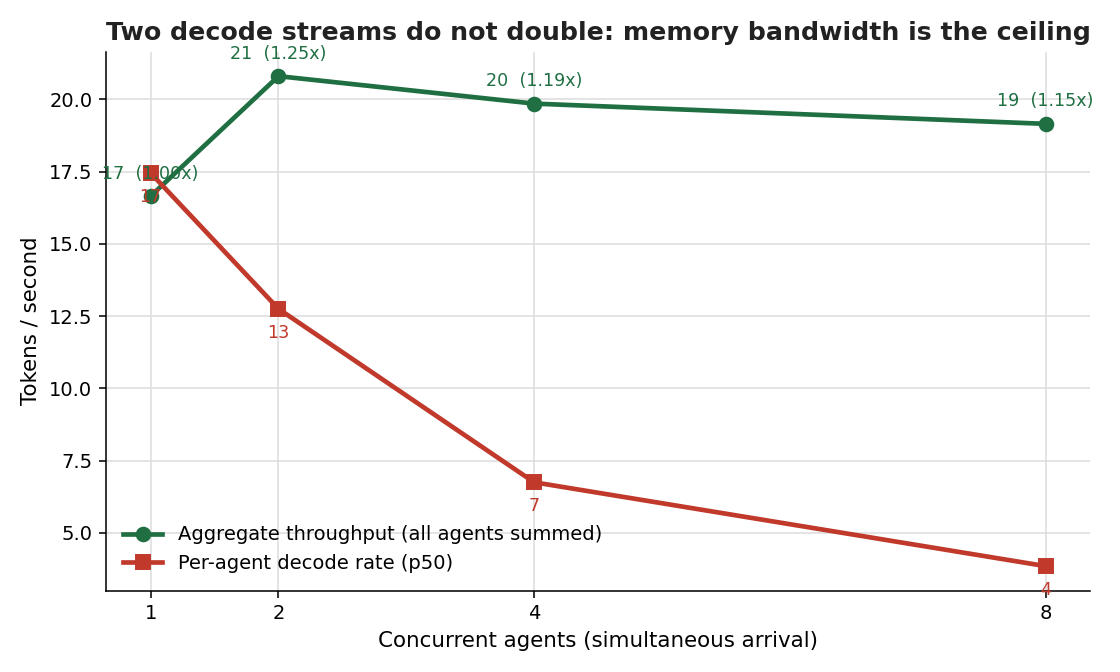
I released 1, then 2, then 4, then 8 identical requests at the same instant and watched two numbers move in opposite directions.
The green line is total throughput, all agents summed. The red line is what any one agent actually feels. Read them together, because the gap between them is the whole story.
| Concurrent agents | Aggregate tokens per second | Per-agent decode rate | Time to first token, median |
|---|---|---|---|
| 1 | 16.6 | 17.4 | 0.46s |
| 2 | 20.8 | 12.8 | 3.51s |
| 4 | 19.9 | 6.8 | 10.68s |
| 8 | 19.1 | 3.9 | 32.16s |
Going from 1 agent to 2 bought me about a quarter more total throughput. Going from 2 to 4 bought me nothing. In fact aggregate throughput went slightly down and kept drifting down at 8. Meanwhile the per-agent rate fell off a cliff, roughly halving with every doubling of agents, from seventeen tokens per second down to under 4. And the wait for the first token climbed from half a second to 32 seconds.
This is Ok-Category2729’s point rendered in ink. The total is close to fixed, so every agent you add does not grow the pie. It cuts your slice thinner. Last week I estimated my knee sat around four agents. This week, with a different prompt-and-output shape and repeated runs, the aggregate peak arrived at 2, not 4. I am not going to paper over that. It is the finding, not a contradiction. The knee is not a fixed number. It moves with the shape of the work, which is exactly what the next reader predicted.
Finding 2: My Own Hypothesis Did Not Show Up The Way I Expected
Here is the part where measuring made me correct myself in public.
Prefill, reading the prompt, is compute-bound. Decode, writing the answer, is memory-bandwidth-bound. My clean hypothesis was that a prefill-heavy workload, a long prompt with a short answer, would batch noticeably better than a decode-heavy one, a short prompt with a long answer. So I built exactly that split and ran the throughput gain going from one agent to two for each.
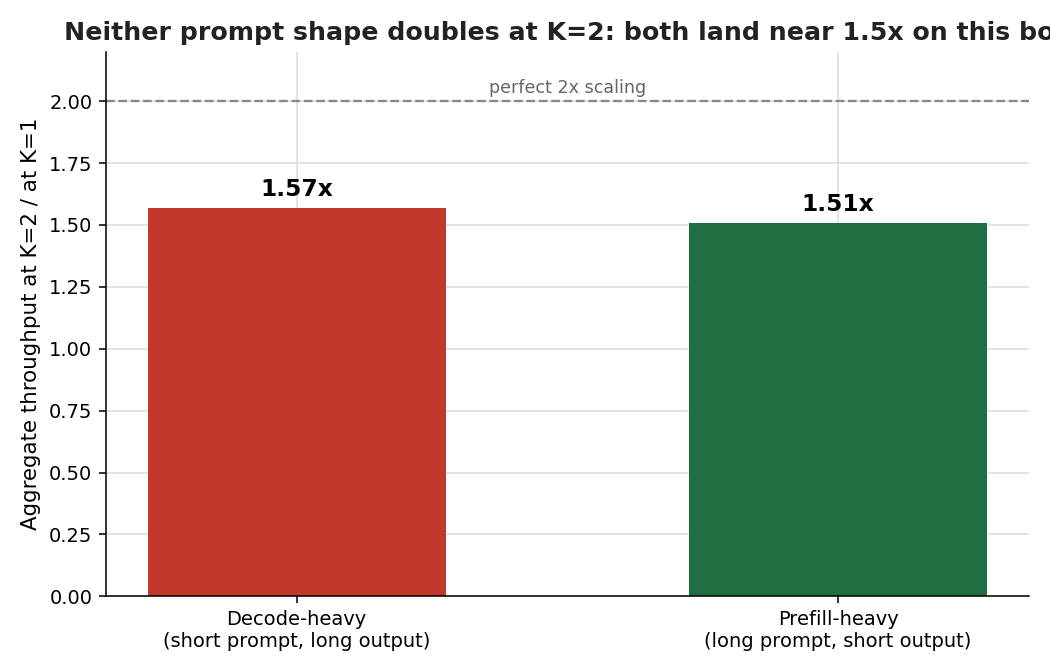
The decode-heavy workload scaled by 1.57 times. The prefill-heavy workload scaled by 1.51 times. They are basically the same, and neither one comes close to the dashed line at 2. My tidy prediction that prefill would clearly win did not appear in this cut. The likely reason is a confound I built in myself: the prefill-heavy job only generates sixteen tokens, so its aggregate tokens-per-second number is dominated by startup timing and is noisy by construction. So the honest read is narrower and more useful than my hypothesis. On this machine, going from one agent to two lands near one and a half times regardless of the mix, and it never doubles. That matches Ok-Category2729’s one-and-a-half-times prediction almost exactly.
I am leaving this section in, hypothesis and miss and all, because the whole reason I run these is to find out where I am wrong. This is what wrong looks like when you actually check.
Finding 3: Longer Prompts Batch Better. This Is Where Prefill Wins.
ReleaseFlashy9582’s question turned out to be the one with the cleanest signal. I swept prompt length across roughly 170, 520, 1,370, and 3,100 measured tokens, and at each length I measured the same thing: how much throughput I gain going from one agent to two.
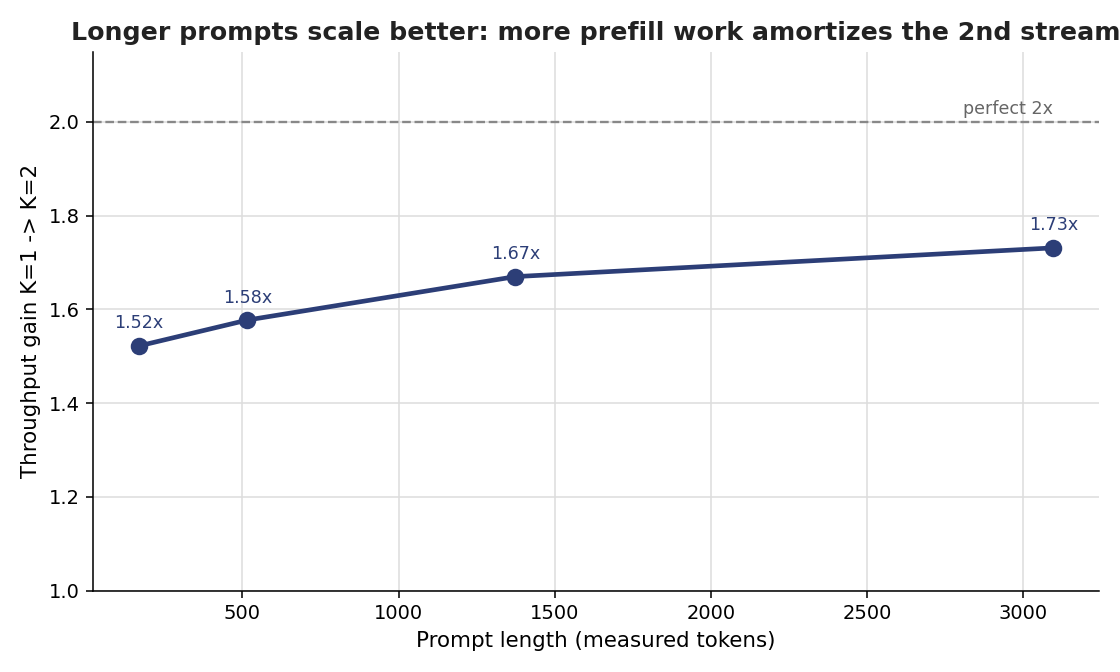
| Prompt length, measured tokens | Throughput gain, one agent to two |
|---|---|
| ~170 | 1.52x |
| ~520 | 1.58x |
| ~1,370 | 1.67x |
| ~3,100 | 1.73x |
The line climbs, and it climbs monotonically. The longer the prompt, the better two agents scale together. This is the prefill advantage that did not show up in Finding Two, showing up cleanly here. A longer prompt means more prefill work, and prefill is the compute-bound phase that actually parallelizes. So the more of your workload lives in reading rather than writing, the more you get out of a second agent. Short chatty turns are the worst case for batching. Long-context work is the best case. ReleaseFlashy9582 was right, and the chart is his answer.
The Big Caveat Doug Ware Handed Me: Dense Is The Hard Case
I want to hand the mic to someone who does this for a living, because he caught the thing I did not test. Doug Ware, who builds applied AI systems, replied to the last post with this: the available memory and TPS are a fixed-ish budget you divide up amongst the slots, and he actually prefers a 35B-A3B mixture-of-experts model over a 27B dense one for daily use, precisely because it leaves him enough TPS to make parallel slots worthwhile. He also said something that maps exactly onto my Hermes stall. In his own tooling he deliberately added switches to turn OFF the parallel behavior that cloud providers leave on by default, because on dense models and slower hardware that default hurts.
Here is why he is right, and why it is a fair asterisk on every chart above. I ran all of this on a 27B DENSE model, which is close to the worst case for this exact ceiling. In a dense model, every single decoded token re-reads all 27B of weights from that one shared memory pool. A mixture-of-experts model like 35B-A3B only activates about 3B parameters per token, so it re-reads a fraction of the memory per token. Less memory traffic per token means more headroom, both for raw speed and for a second slot to actually pay off. So the honest scope of my result is this: concurrency does not scale WELL on a dense model on my hardware. Swap in the right MoE and the math shifts in your favor. That is the next thing I am going to measure, along with a serving-stack change Doug pointed me at that may finally unlock the speculative decoding I could not turn on last time. Wait for it.
One More Honesty Beat: The Machine Is Noisy
I want to name something the reps exposed. The exact same nominal workload, a 520-token prompt going from one agent to two, measured 1.25 times in one part of the matrix and 1.58 times in another, minutes apart, on the same machine. That is real single-machine variance, from thermal drift, background load, and scheduling. It is why I ran repeats and reported medians, and it is why I am telling you the honest shape of the result is a range, not a decimal to trust to two places. Anyone who hands you a single clean concurrency number from one laptop is selling you a vibe. The robust, repeated finding across every run is the one that survives the noise: one to two helps a little, past two does not, and per-agent speed and first-token latency degrade hard the whole way up.
The Part I Did Not Stage: An Agent Walked Into This Wall
Here is where the charts stopped being theory. This same afternoon, separate from the benchmark, I gave a local agent a real task. Read a batch of my own working files in my vault, and to go faster, split the reading across two helper sub-agents running at the same time, against the same one local model. The agent planned it cleanly. It counted the folder, found sixty-nine files across three subfolders, and split the work by folder into two parallel branches.
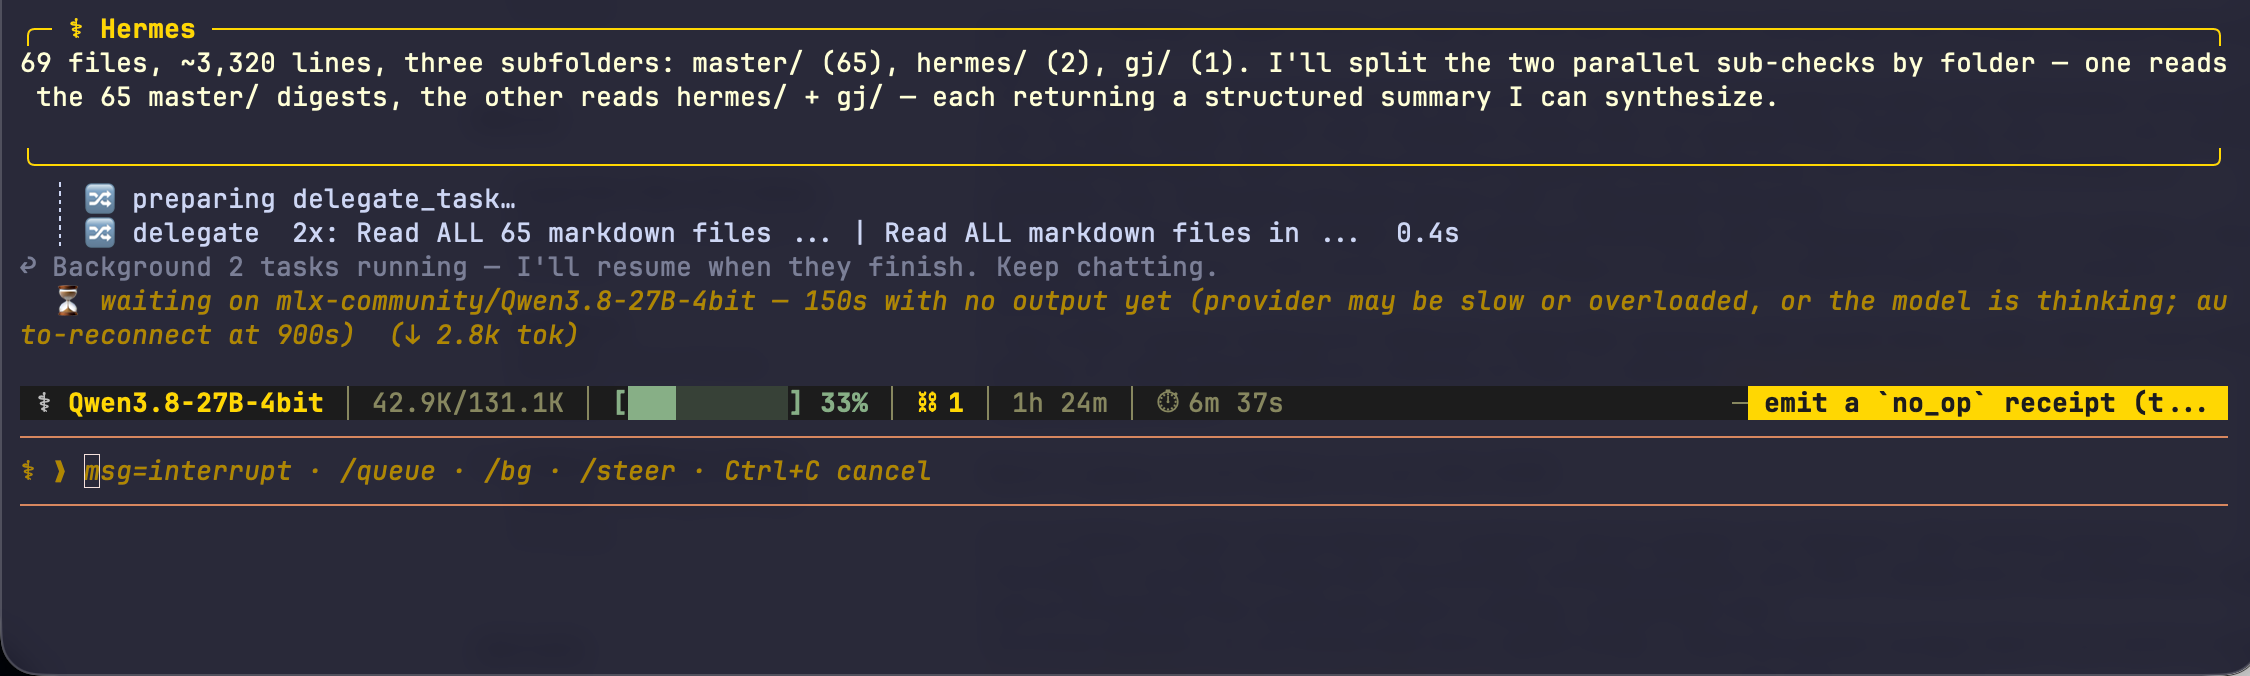
Before I go further, one honesty note, because it matters for the governance point later. This was not a case of no safety in the loop. When the agent went to run a shell command, a safety prompt stopped and asked me to approve it first, which is exactly what it should do. I approved it. The stall that followed was not a guardrail and not a bug. It was physics.
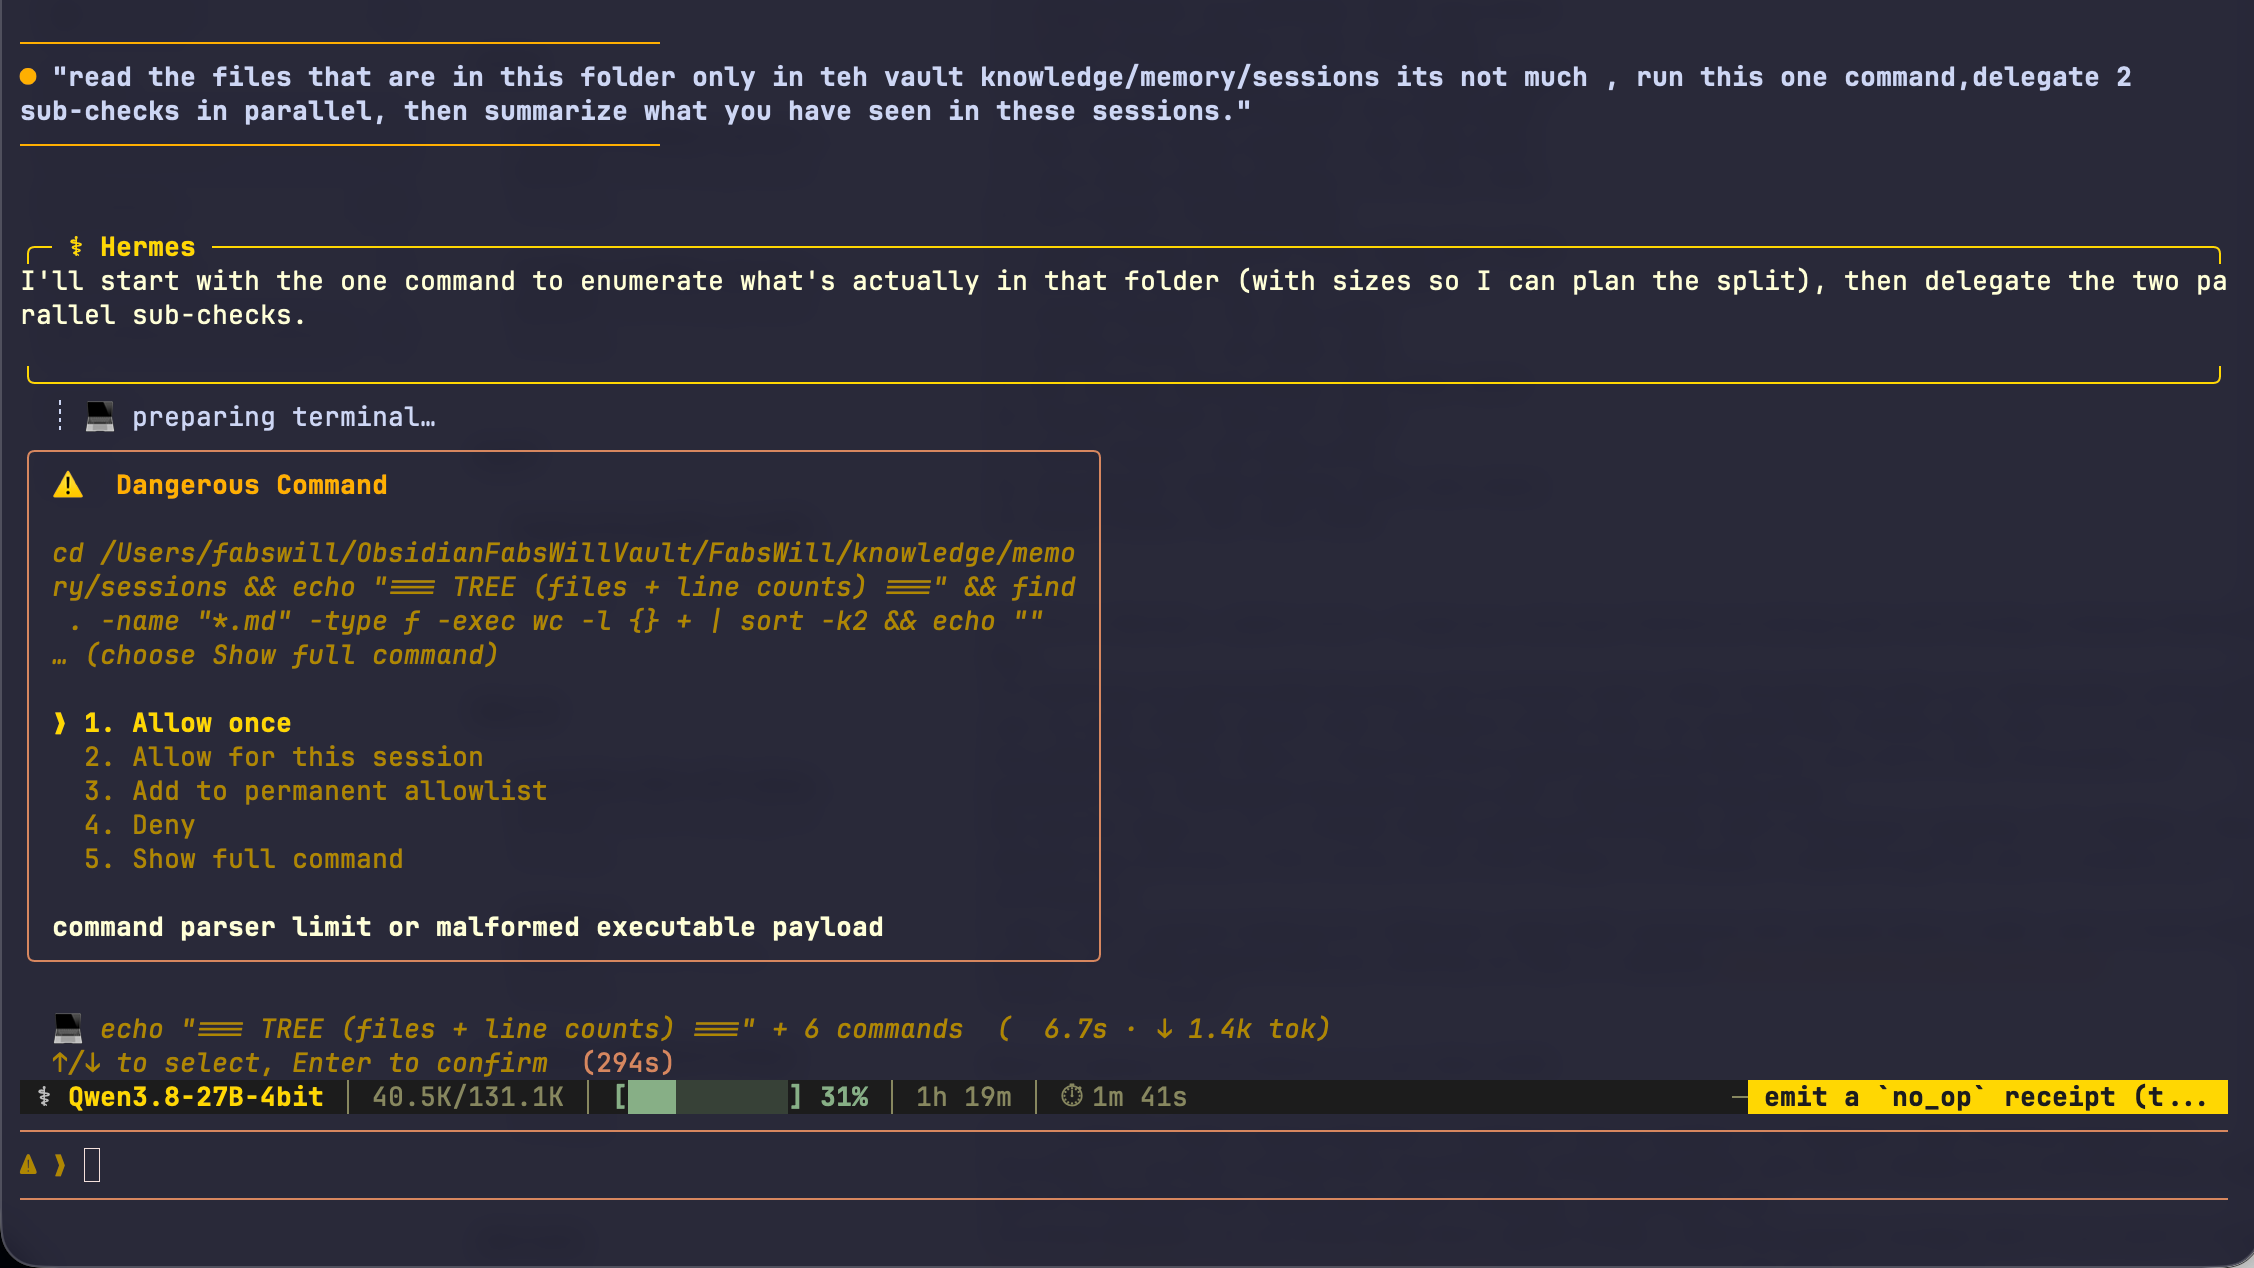
Then the two helpers went out at the same time, and both stalled. Each one waited the full three-minute threshold with no response from the model, aborted, retried, and timed out again, three attempts each. The endpoint was healthy the whole time. The GPU tells the real story. It sat pegged at one hundred percent utilization on the M3 Max the entire time the calls were timing out. The machine was not idle and waiting. It was completely saturated, and still could not feed three decode streams fast enough for any single one to answer before the timeout.
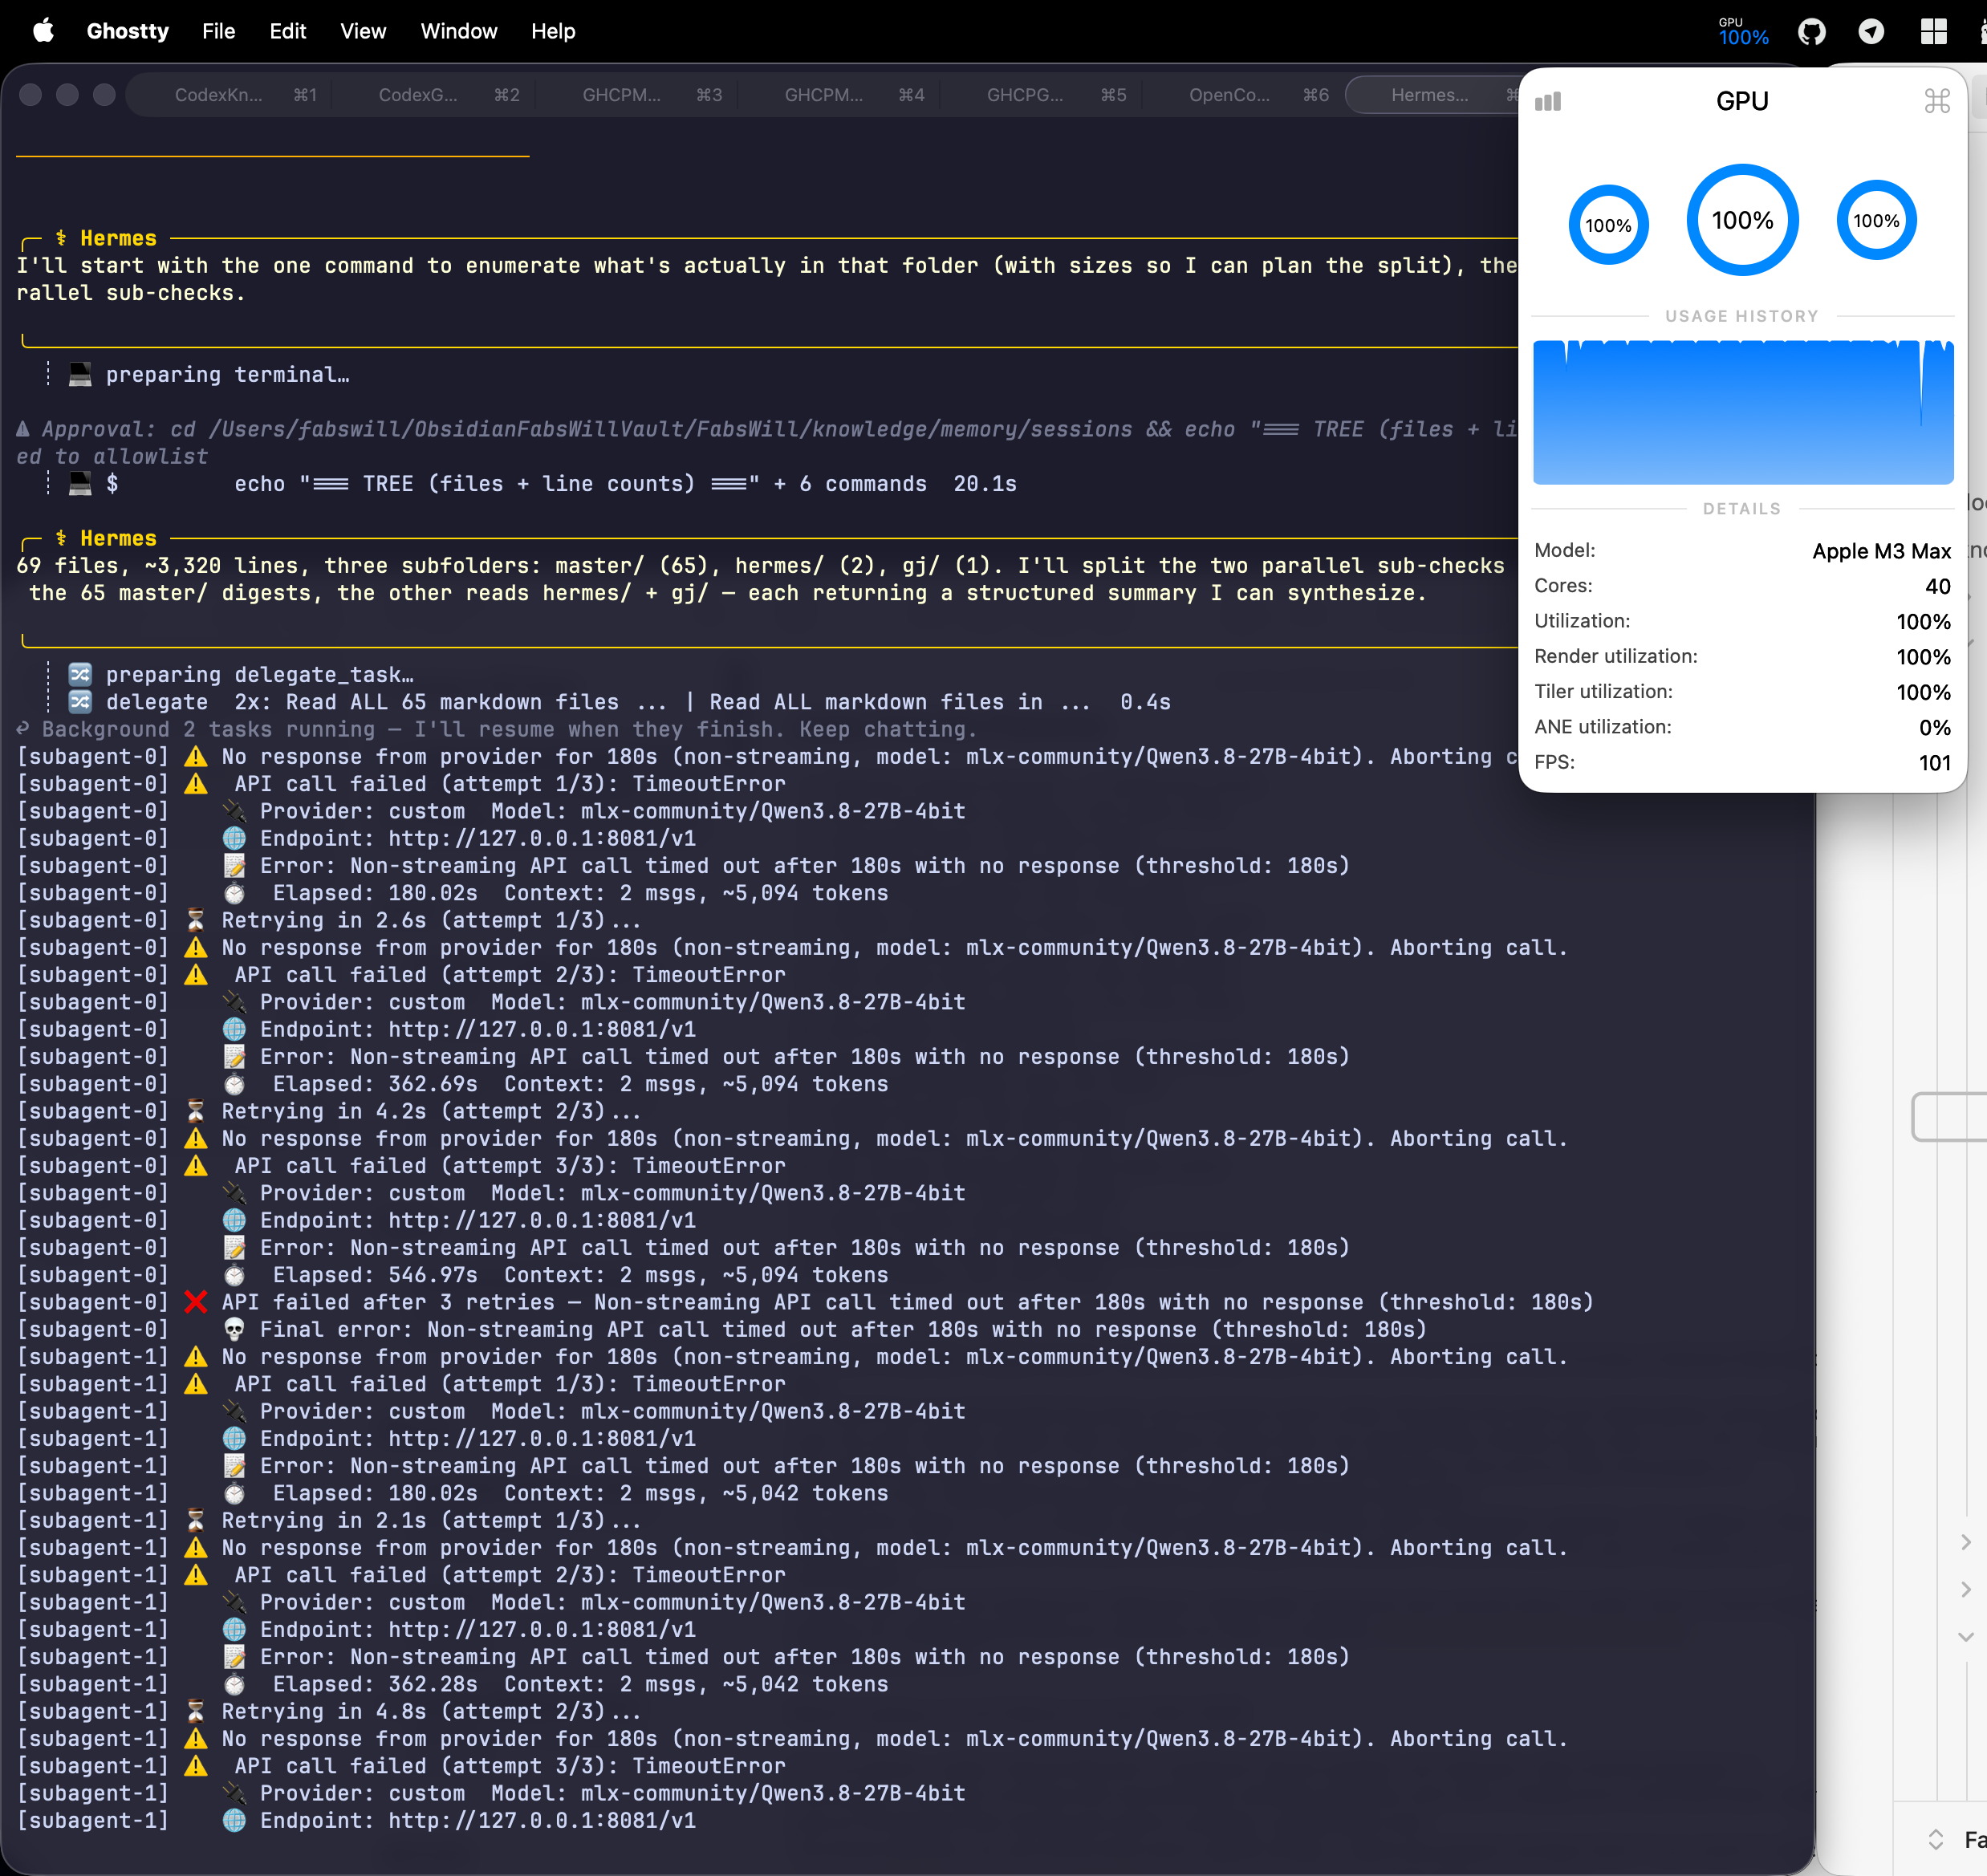
This is Finding One in the flesh. The parent plus its two helpers were three decode streams fighting over one fixed pool of memory bandwidth, so each one crawled, and every one blew past the timeout. The branches did eventually finish, but only after roughly nine hundred and eighty seconds each, and by the time I stepped in the parent had been waiting over three thousand five hundred seconds. A task I expected to take a couple of minutes turned into the better part of an hour, because I asked one small local model to be in three places at once.
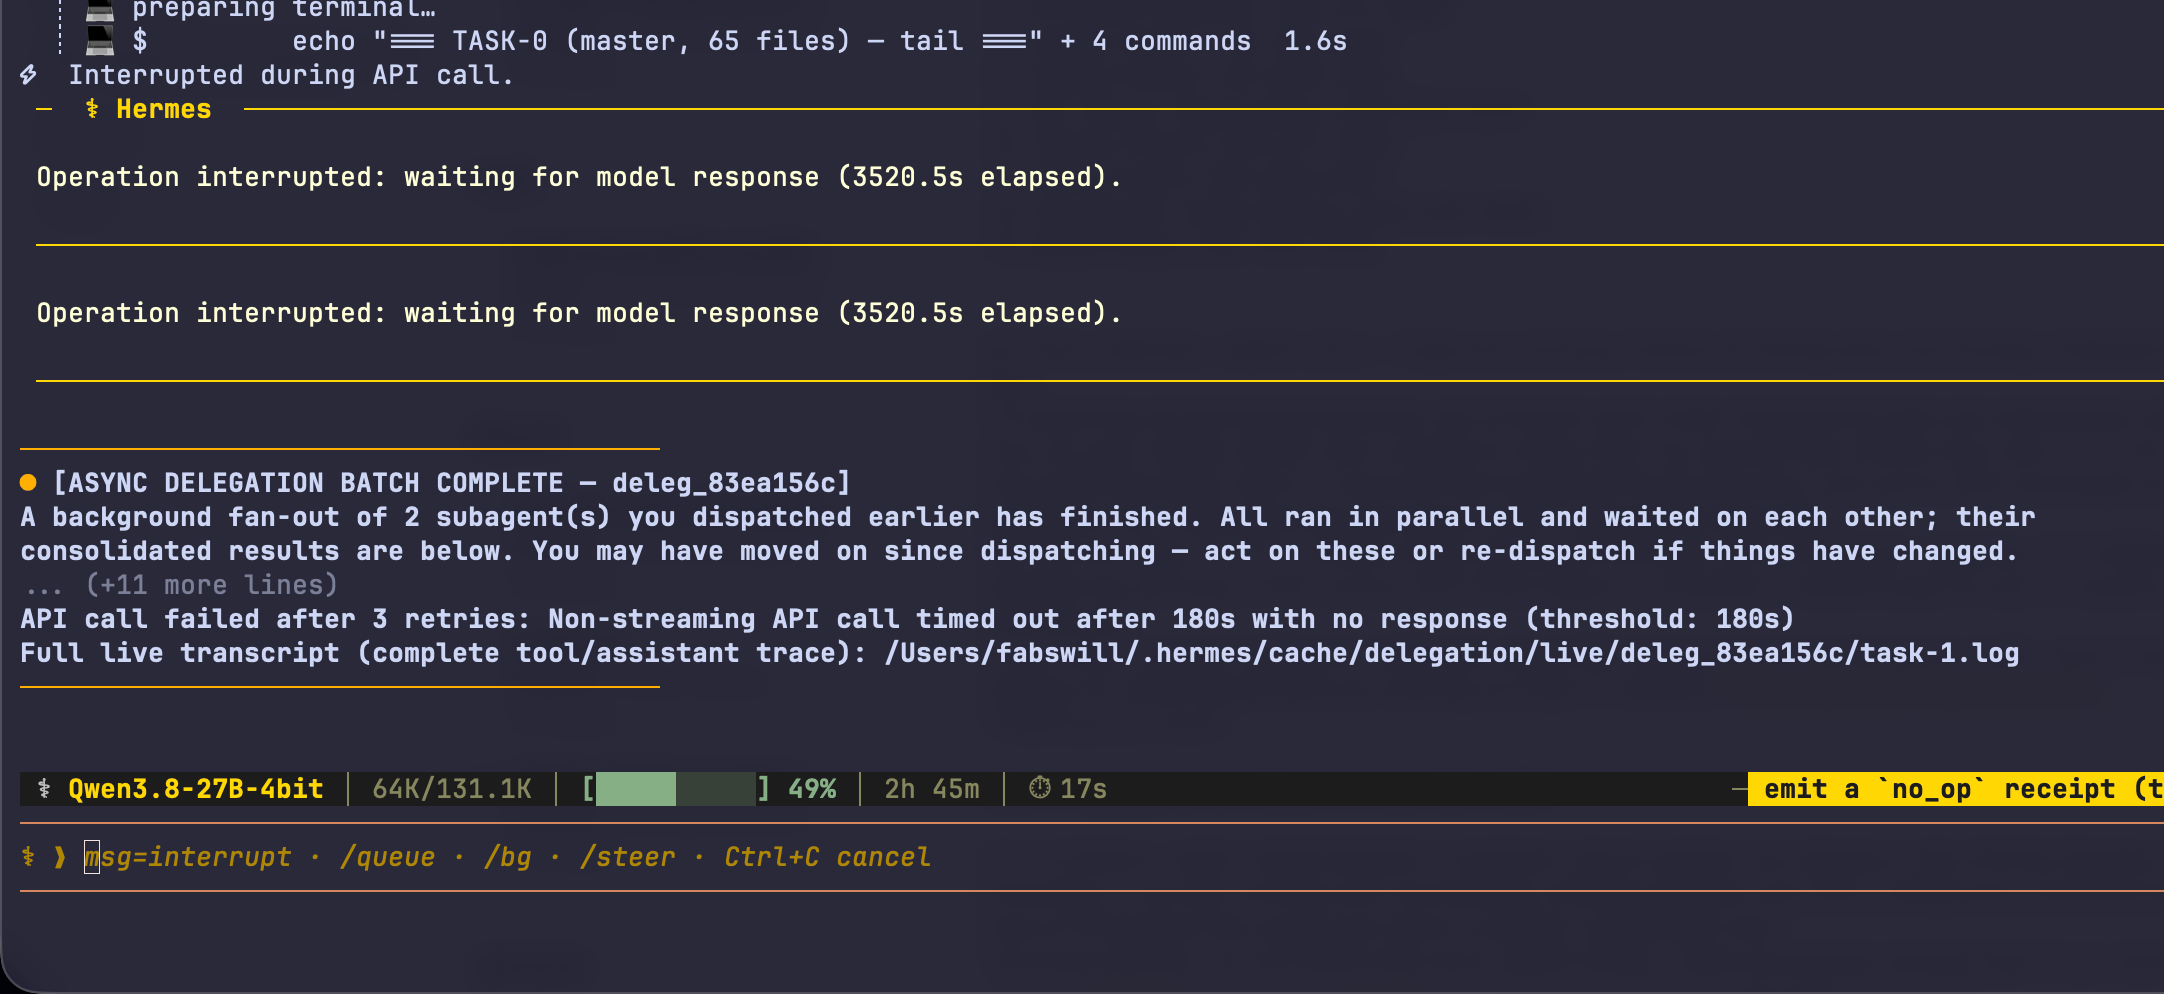
I did not design that failure to prove a point. It just happened, on the day I happened to be measuring the exact thing that caused it.
The lesson lands harder because it was lived, not staged. On one local model, fanning a task out to a swarm of helpers is not free parallelism. It is the same fixed budget cut into more, slower pieces, and past the knee it can finish slower than doing the work in a tighter sequence. The pattern that actually works on this hardware is a strong planner with cheap, few workers, not a strong planner with many hungry ones. If you want real fan-out, the helpers need to go to a different, lighter endpoint, not pile onto the one bus the planner is already using.
From Trial To First-Class Citizen: How I Actually Onboard A New Agent
The agent that stalled was a brand-new harness I am trialing, not the setup I usually run. That is worth pausing on, because the interesting part is not that it stalled. It is that a runtime I had been using for about a day was already a full citizen in my governance system, and nothing about swapping runtimes fragmented my trail. That did not happen by luck. It is a deliberate onboarding I run for every new agent, and this week I ran it on this one.
Two things make an agent first-class for me, and neither lives inside the tool. First, it emits a receipt for its own work under my single account, so its output sits in the same graded ledger as every other agent I run. Second, it reads from and writes to my vault, so its memory is mine and outlives the runtime. This week the new agent earned both. Here is the receipts ledger with its own entries in it, next to the work from my other tools.
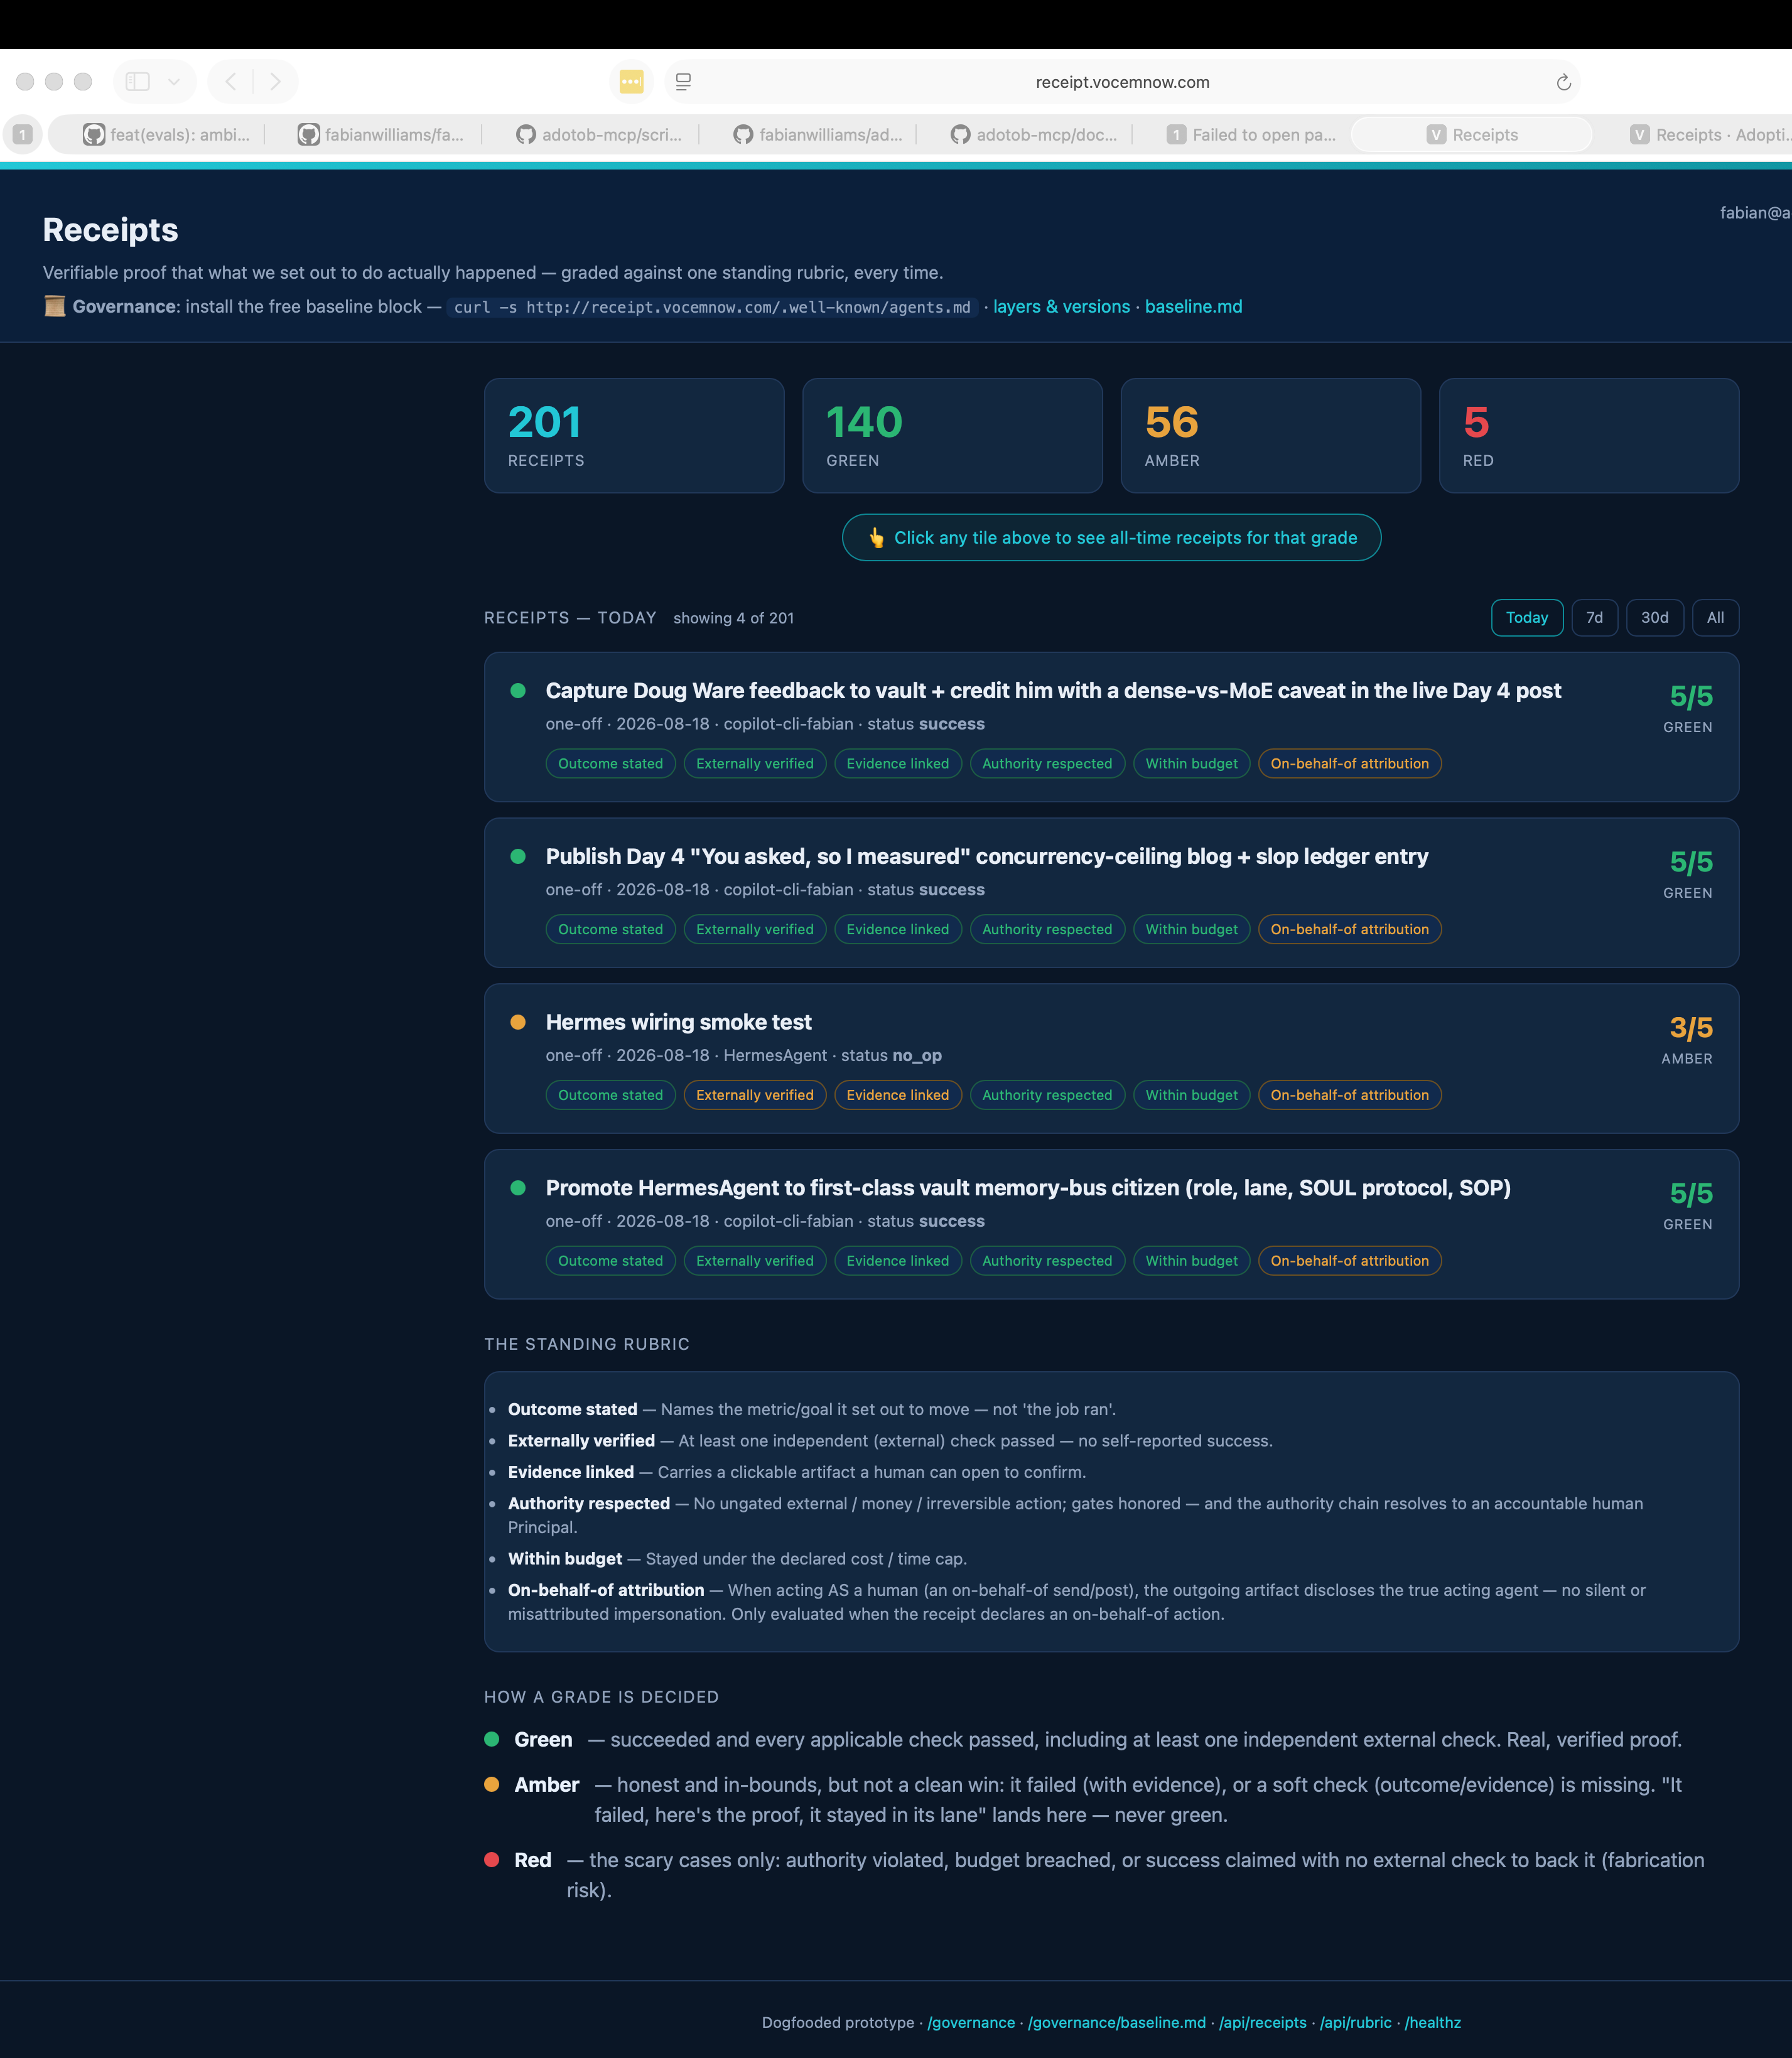
Look at what that board is actually saying. Every objective any of my agents finishes ends with a verifiable, rubric-graded receipt: green when it succeeded with independent external proof, amber when it honestly did not, red for the scary cases. The new agent is right there in the same ledger, including a green receipt for the moment I promoted it to first-class citizen and an amber one for its wiring smoke test, graded honestly because a smoke test is not a real win. It is not that I trust the new tool. It is that I do not have to, because the same standard grades all of them.
And the memory half is the same idea. I keep every agent’s memory in one place I own, my vault, rather than in the tool, so what it learned this afternoon survives the tool and is already waiting for the next agent that reads it.
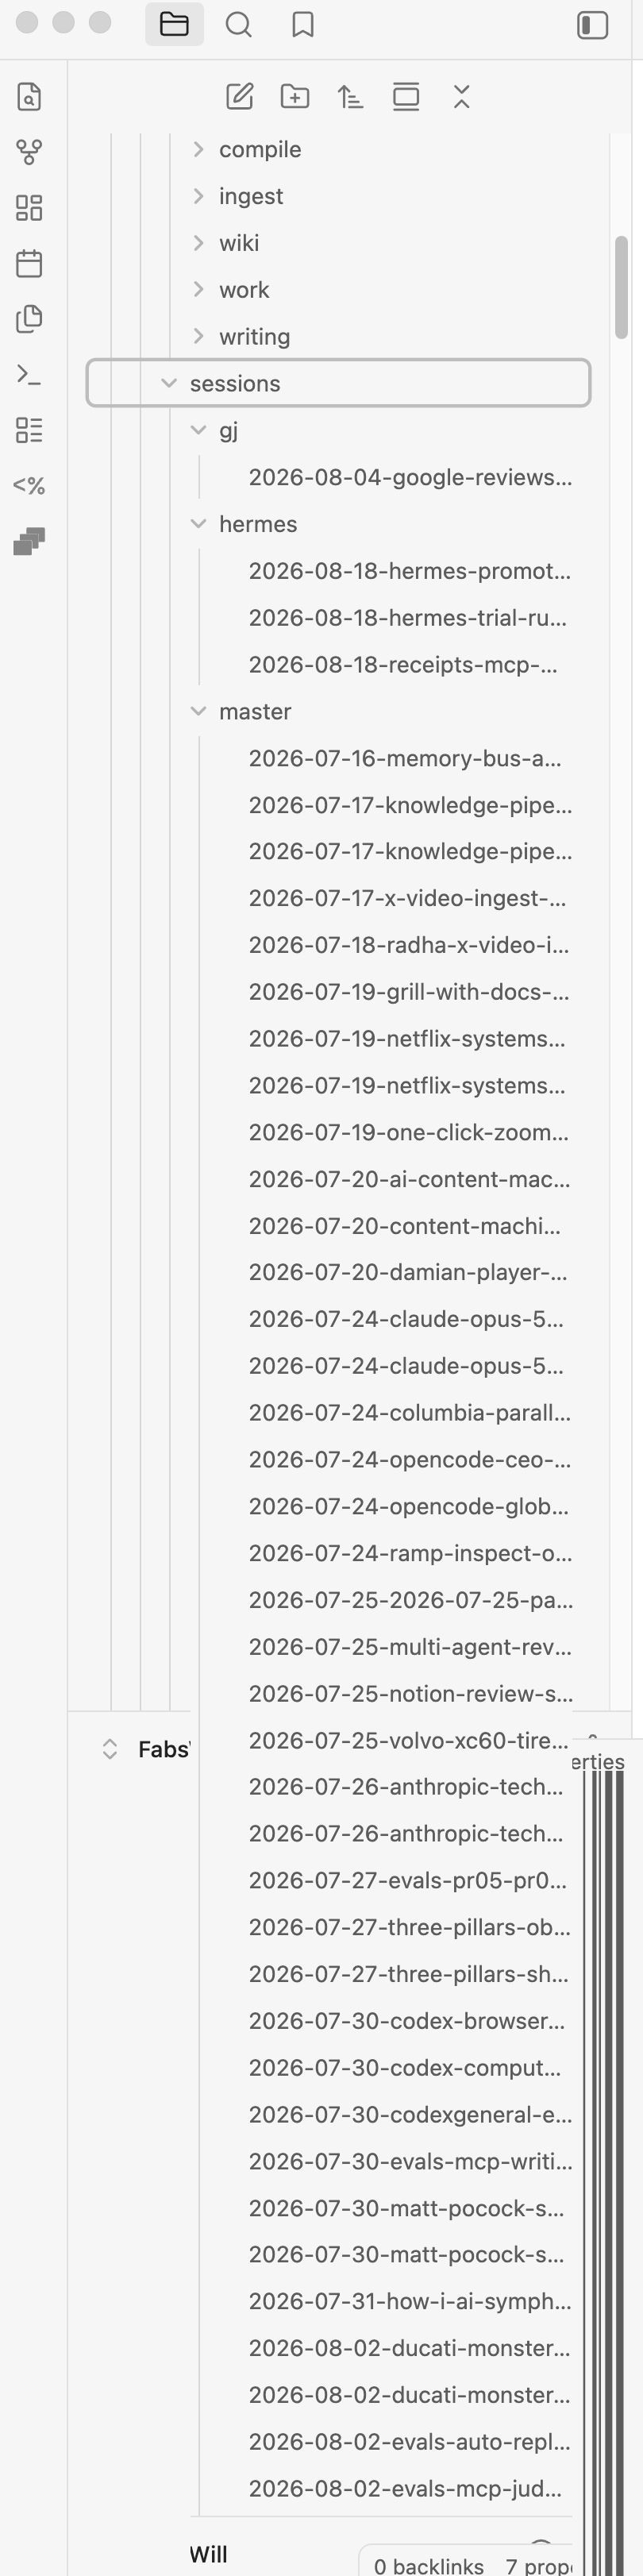
That folder is the whole idea in one picture. Every agent I run writes what it learned into a lane I own, so the memory outlives whichever runtime happened to produce it.
None of this is bespoke to one blog post. The receipts standard, the rubric, and the onboarding loop are a framework I run in production, and my company packaged it as the Receipts Governance Kit on the Adotob store. The short version of the framework is a single loop every agent follows: get the intent, decompose it, clarify the missing inputs, act, and end with a receipt. There is an honesty gate that refuses to rubber-stamp a success it cannot externally verify, and cross-agent reconciliation so two agents working one objective each emit under a shared binding. The public floor of it, the standing rubric and the baseline block, is readable by anyone at the governance baseline. That is how a one-day-old runtime was already a trusted citizen. The governance came first, and the runtime plugged into it.
Rent the intelligence, own the harness, and own the memory and the receipts on top of it. The runtime is the disposable part.
The Receipt For This Piece
| Signal | This piece of work |
|---|---|
| Where the numbers came from | A barrier-synchronized load driver I wrote, firing at the live server |
| Human-launch bias in the measurement | Removed by design, all requests released at the same instant |
| Loads behind the three charts | 36, across a concurrency sweep, a prefill-versus-decode split, and a prompt-length sweep |
| Repeats per point | 2 to 3, reported as medians |
| Predictions I was handed and tested | 3, from named commenters |
| Expert caveat added after publish | 1, credited to Doug Ware, dense-vs-MoE scope |
| Live agent stall shown | Real screenshots, GPU meter and timeout logs, not a redraw |
| Governance shown, not just claimed | Real receipts dashboard, plus the public framework and rubric linked |
| Predictions that held | 2, the bandwidth ceiling and the prompt-length effect |
| Predictions that did not show up as I expected | 1, prefill-versus-decode, correction kept in |
| Numbers estimated or rounded from vibes | 0 |
| Is the test rig reproducible | Yes, the driver, prompts, and run matrix are on disk |
The full standard behind this, and why I attach a receipt to work like this, is on the slop page.