🚀 Purpose
If you’ve ever wondered how to compare a locally‑hosted LLM with a hosted OpenAI model side‑by‑side, while keeping the whole experiment observable from end‑to‑end, you’re in the right place. This one‑pager walks you through the starter repo that stitches together three distinct paths:
| Path | Stack | Observability |
|---|---|---|
| A | .NET 8 + Semantic Kernel + Ollama (local model) | Azure Monitor (OTEL) |
| B | OpenAI Agents SDK (TypeScript/Node) | OpenAI Logs → optional OTLP → Azure Monitor |
| C | Python Evals (OpenAI‑provided) | Same prompts, same metrics |
The goal? A clean, reproducible harness that lets you run the same prompt against a local model and an OpenAI model, invoke tools, and then score the outputs with a single Python‑based eval suite. All of this is fully instrumented with OpenTelemetry, so you can follow the request flow from the client code right into Azure Application Insights (or any OTEL backend you prefer).
TL;DR – Pull a model, set a connection string, run a few commands, and watch the trace heat‑maps light up in the OpenAI Dashboard and Azure Monitor.
🛠️ What This Delivers
| ✅ Feature | Description |
|---|---|
| Side‑by‑side harness | Run a local Ollama model and the hosted OpenAI model from the same code base. |
| End‑to‑end tracing | OpenAI’s built‑in agent tracing, OTLP → Aspire, and Azure Monitor correlation all work out of the box. |
| Consistent naming & config | A single source of truth for agent names, tool definitions, and environment variables across .NET, TypeScript, and Python. |
| Unified evaluation | Python Evals score the outputs of both implementations with identical prompts and metrics. |
| Dashboard‑ready | Visual validation in OpenAI Logs, Aspire UI, and Azure Application Insights KQL queries. |
🧠 Architecture At A Glance
graph LR
    subgraph TS[TypeScript]
        A[OpenAI Agents SDK] -->|traces| O[OpenAI Logs]
        A -->|OTLP| Aspire
    end

    subgraph NET[.NET 8]
        B[Semantic Kernel + Ollama] -->|OTEL| AzureMonitor
    end

    subgraph PY[Python]
        C[OpenAI Evals] -->|compare| A & B
    end

    O -->|correlate| AzureMonitor
    Aspire -->|export| AzureMonitor
- TypeScript –
@openai/agentsships with first‑class tracing that lands in the OpenAI Dashboard. You can pipe the same OTLP stream to Aspire (the .NET observability stack) and forward it to Azure Monitor. - .NET 8 – Semantic Kernel drives the Ollama‑backed LLM. The built‑in OpenTelemetry exporter ships traces directly to Azure Monitor (or any OTEL collector you configure).
- Python – The official OpenAI Evals library runs the same prompt against both agents and produces a CSV/JSON report you can drop into a dashboard.
Dashboard Snapshots
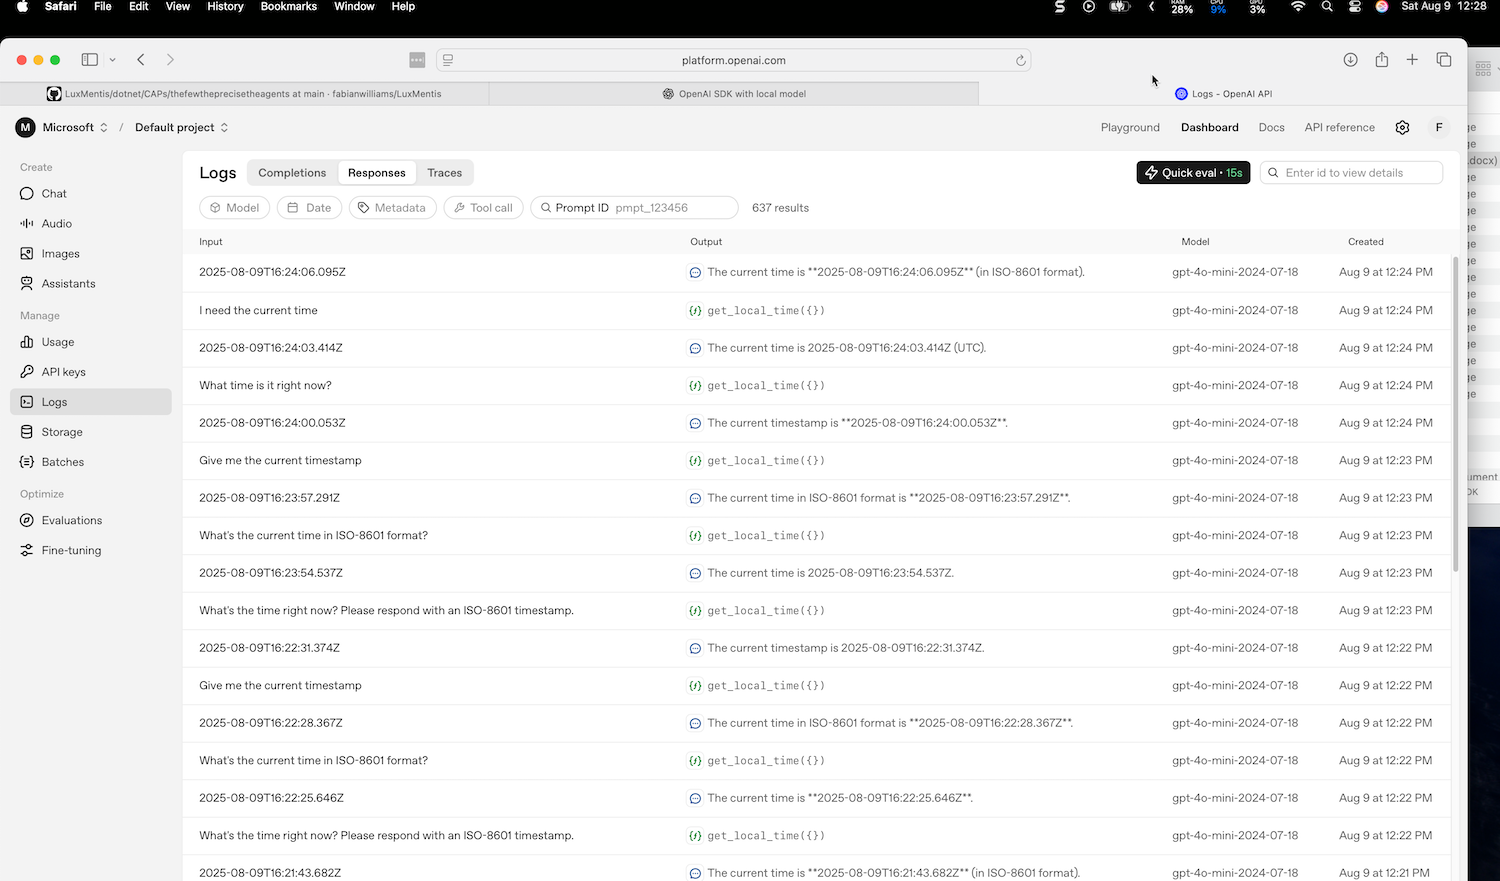
| OpenAI Dashboard – Agent Workflows | Azure Application Insights – KQL |
|---|---|
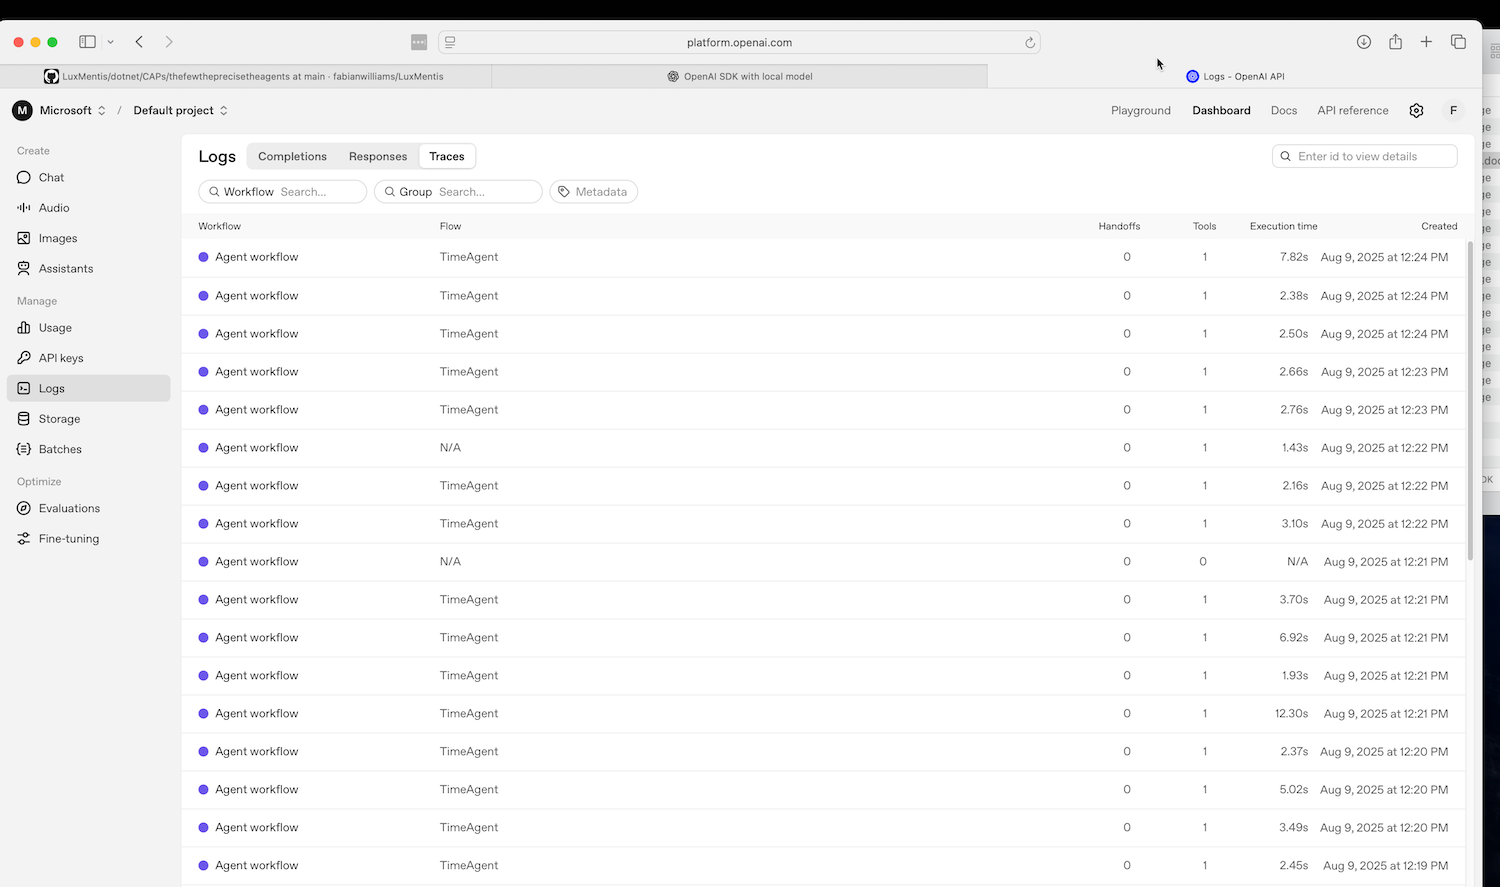 |
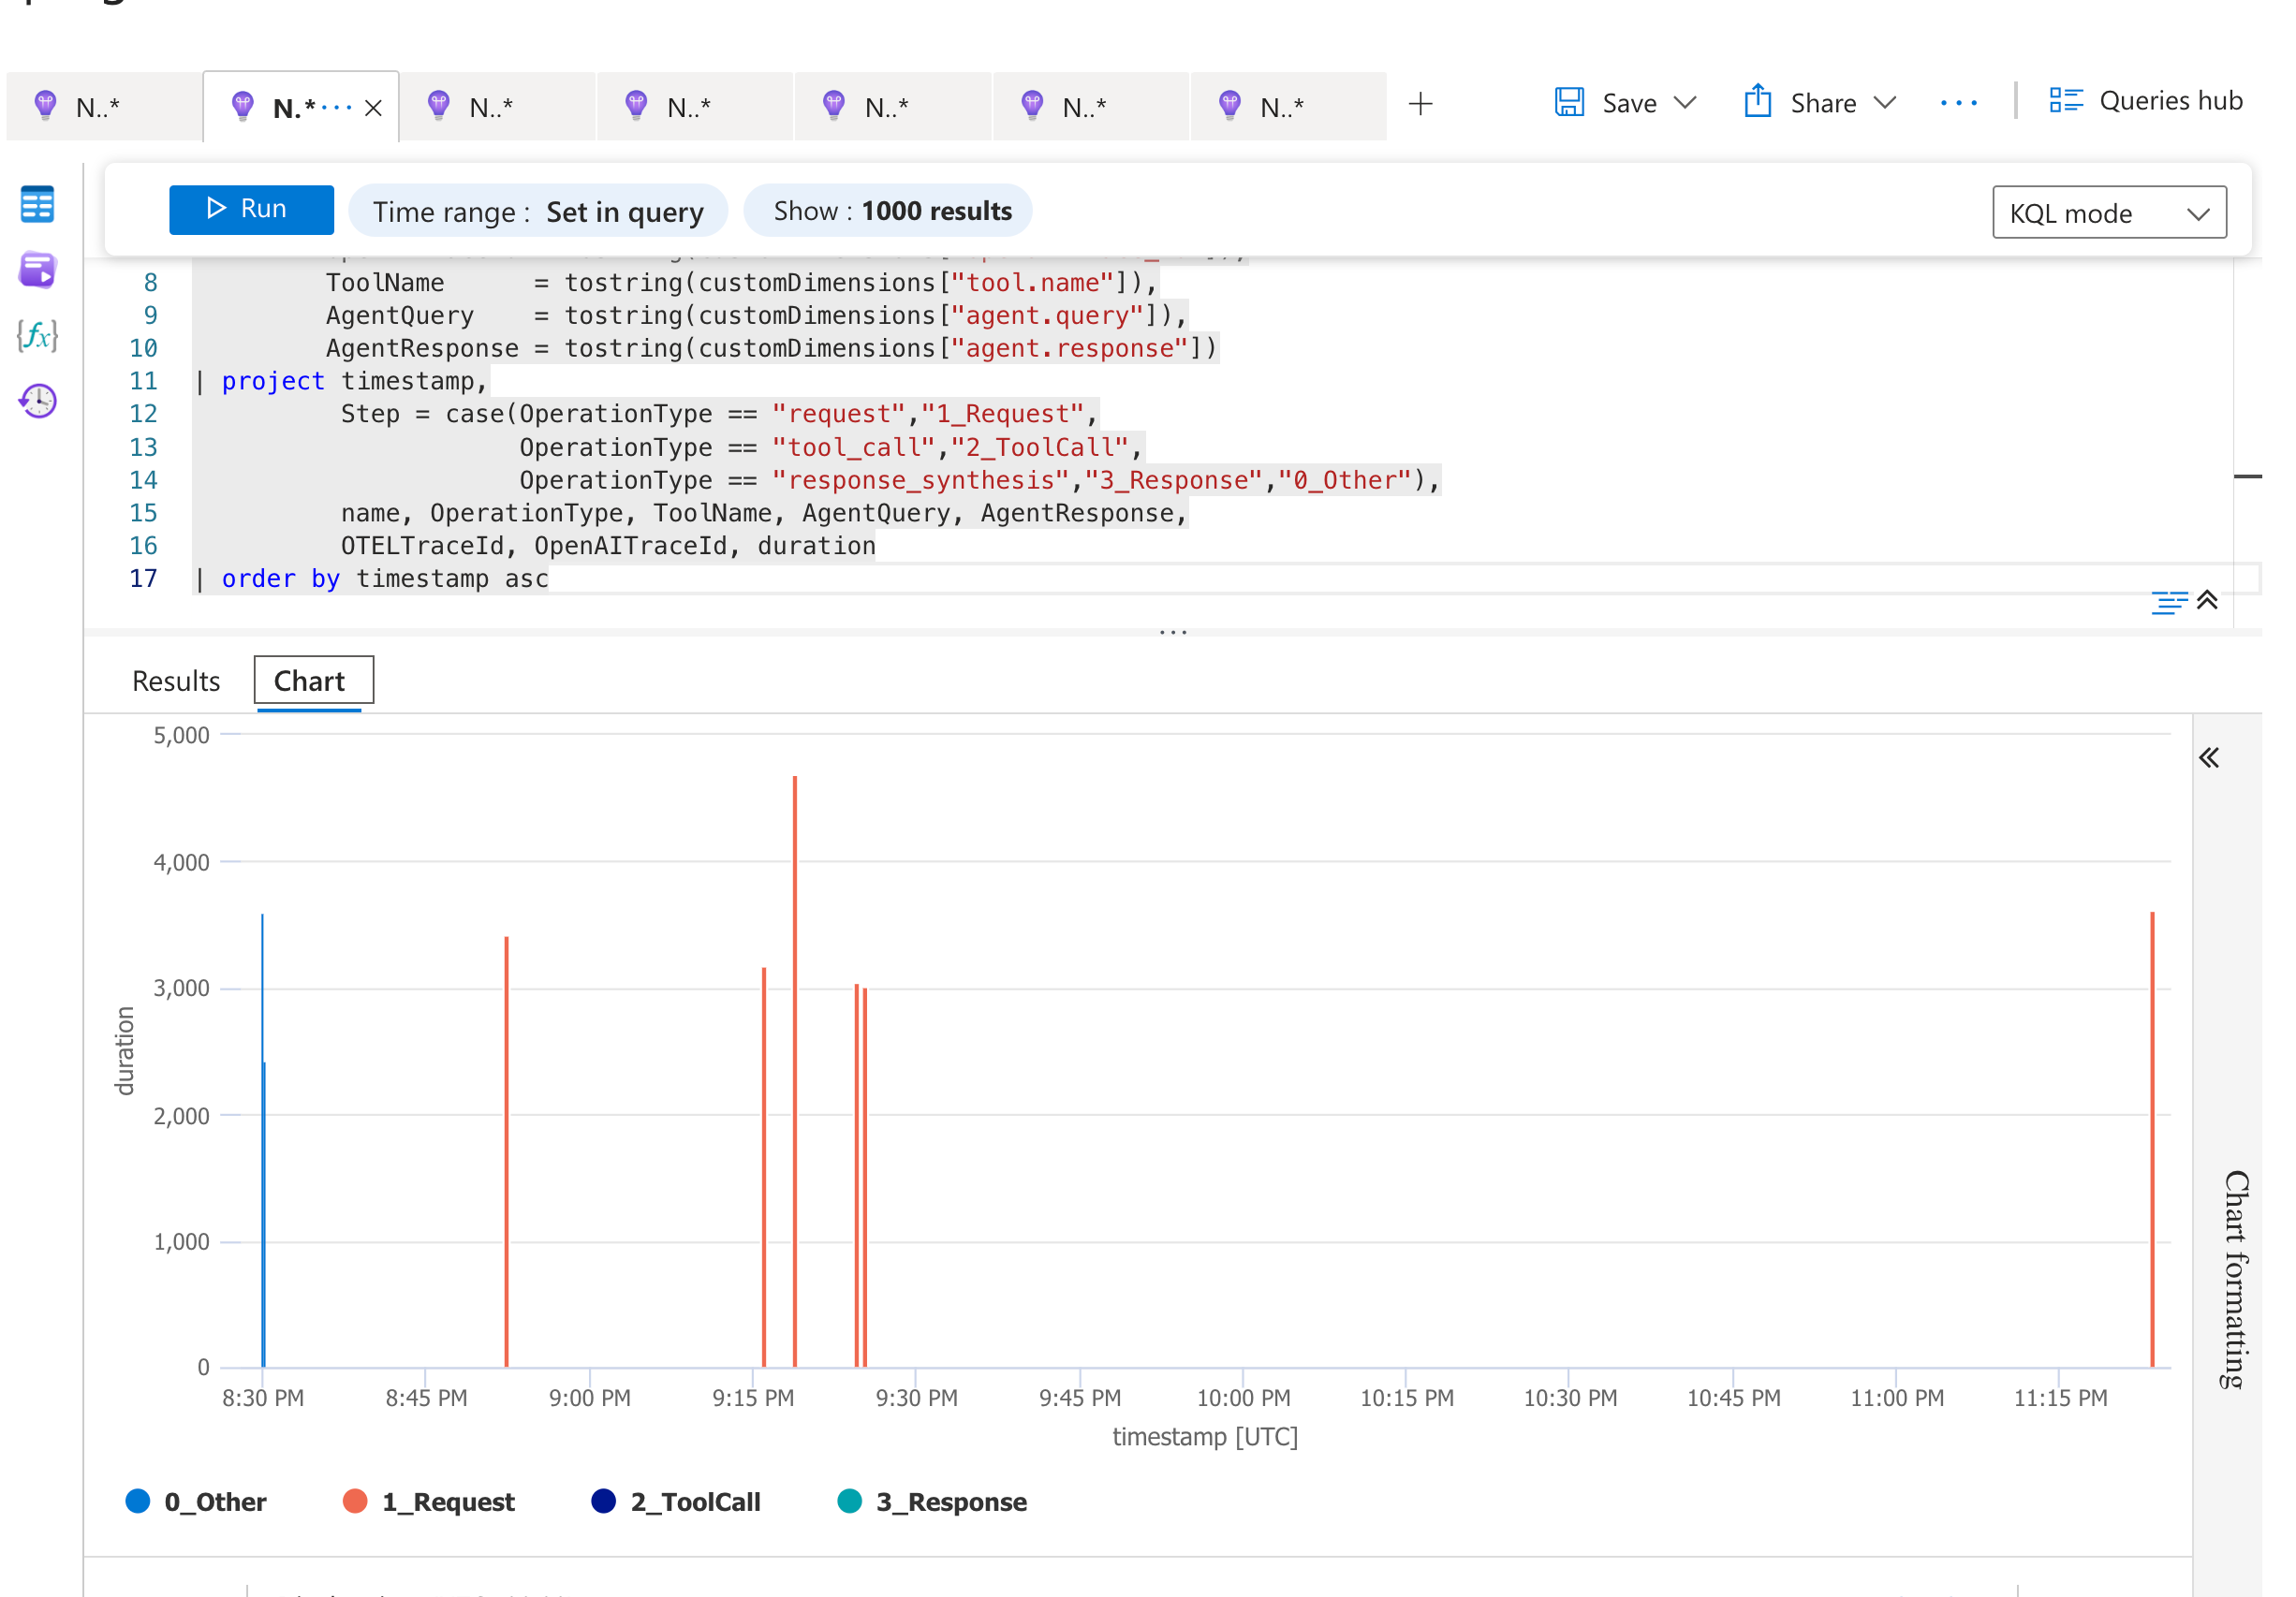 |
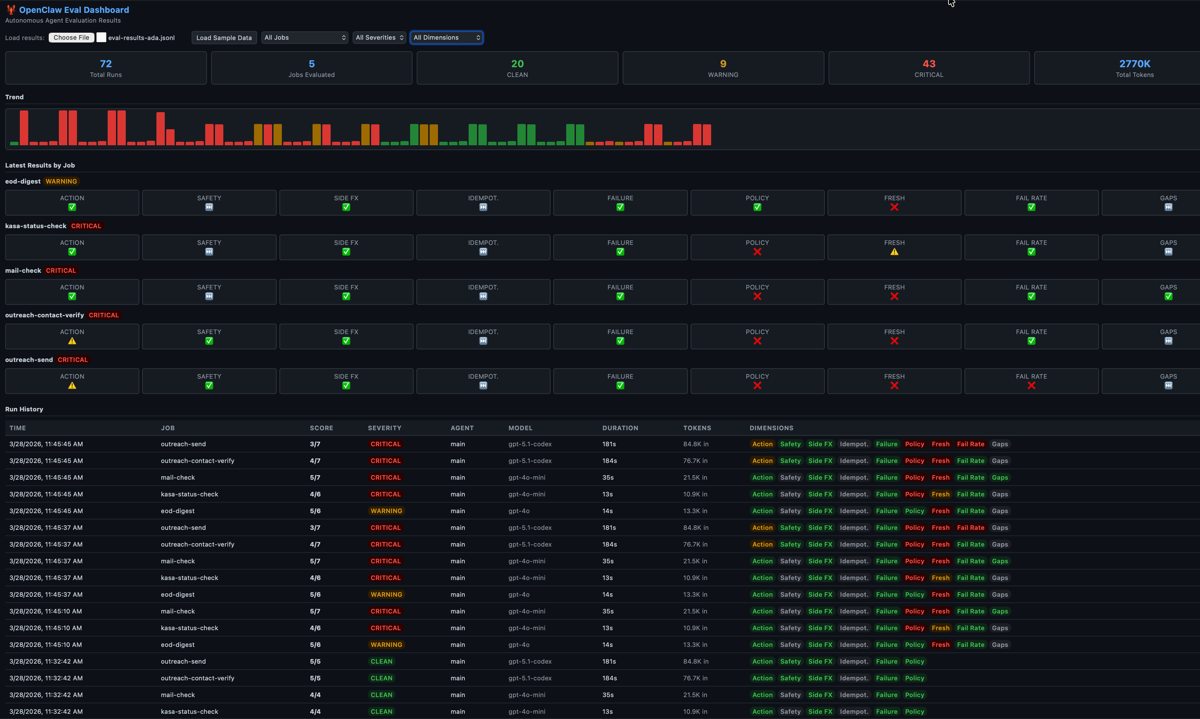
| TimeAgent executions with full tool‑call traces | KQL query visualizing items ingested by the .NET agent |
 |
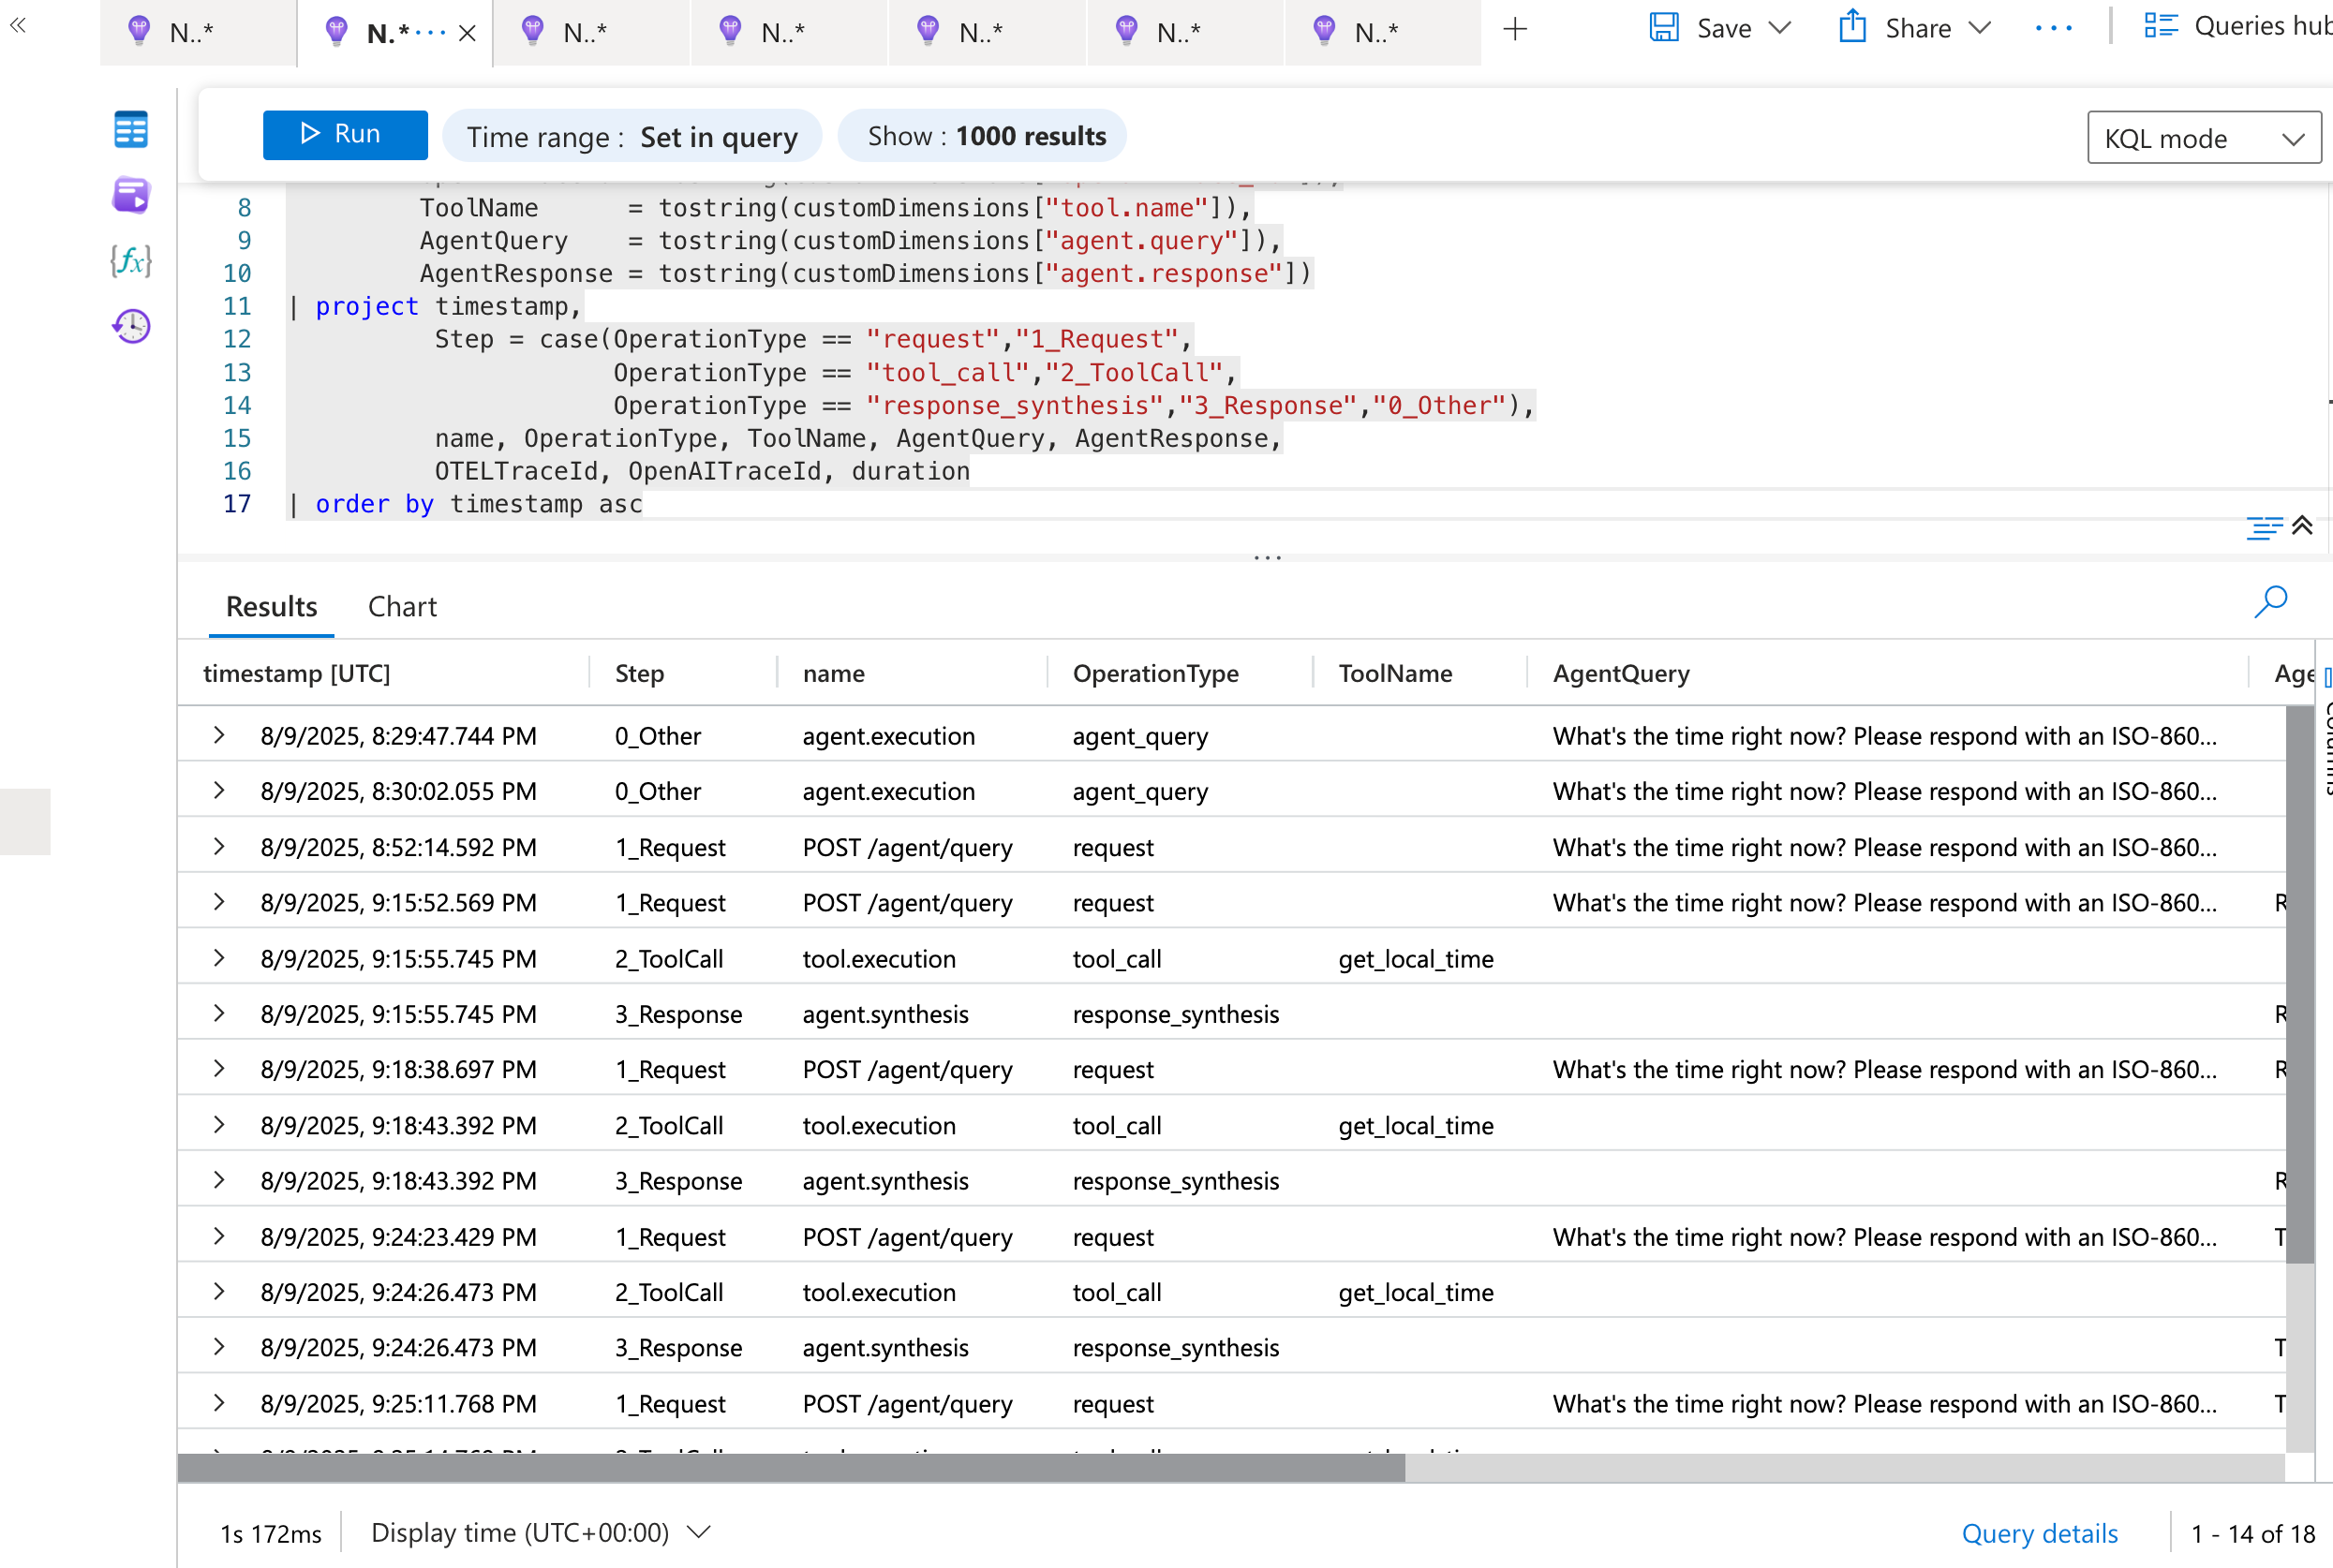 |
| Comprehensive test results with tool call details | Raw query results |
📋 Quick Start (Happy Path)
Below is the minimum you need to see a trace surface in both OpenAI Logs and Azure Monitor. Each block assumes you’ve already cloned the starter repo.
1️⃣ .NET + Ollama
# Pull a tool‑capable model (once)
ollama pull gpt-oss-120b   # or any other model that supports function calls

# Export your Azure Monitor connection string (or any OTEL endpoint)
export AZURE_MONITOR_CONNECTION_STRING="InstrumentationKey=xxxxxx-xxxx-xxxx-xxxx-xxxxxxxxxxxx"

# Run the .NET sample
cd sk-ollama
dotnet run
What to look for – In Azure Monitor, filter on service.name = "SkOllamaAgent". You’ll see a trace that includes the prompt, the tool invocation, and the final LLM response.
2️⃣ OpenAI Agents SDK (Node/TypeScript)
# Install the SDK + Zod (for schema validation)
npm i @openai/agents zod@3.25.67

# Set your OpenAI key
export OPENAI_API_KEY="sk-..."

# Run the sample (it lives under /ts-agents)
cd ts-agents
npm run start
What to look for – Head to the OpenAI Dashboard → Logs. The request appears under the Agent tab with a built‑in trace that shows each tool call as a separate span.
Optional OTLP export – If you want the same data in Azure Monitor:
export OTEL_EXPORTER_OTLP_ENDPOINT="https://<your-aspire-endpoint>/v1/traces"
export OTEL_RESOURCE_ATTRIBUTES="service.name=TsOpenAIAgent"
npm run start   # traces now flow to Aspire → Azure Monitor
3️⃣ Python Evals
# Create a virtual env
python -m venv .venv && source .venv/bin/activate

# Install OpenAI Evals
pip install openai-evals

# Run the evaluation suite (the repo ships a ready‑made eval.yaml)
openai-evals run evals/compare_agents.yaml \
  --model gpt-4o-mini \
  --output results.csv
The compare_agents.yaml file points to the two agents you just spun up (local endpoint for Ollama, OpenAI endpoint for the TypeScript agent). The resulting CSV contains scores for relevance, tool‑use correctness, and latency.
🎯 Practical Advice & Gotchas
| ✅ Tip | 🛑 Pitfall |
|---|---|
Pin your model version – Ollama models are mutable. Use ollama pull <model>:v1.2.0 and reference the exact tag in your code. |
Forgot to export OTEL env vars – Traces silently fall back to a no‑op exporter. Double‑check OTEL_EXPORTER_OTLP_ENDPOINT and AZURE_MONITOR_CONNECTION_STRING. |
| Leverage Zod schemas – They give you compile‑time safety for tool input validation in the TypeScript agent. | Mismatched tool signatures – The .NET Semantic Kernel and the TypeScript SDK must agree on the JSON schema; otherwise you’ll see “function call validation error” in the trace. |
Use a single service name across all languages (AgentDemo) so you can aggregate spans in Azure Monitor. |
Cross‑region latency – If your Aspire instance lives in a different Azure region than your Application Insights resource, you’ll see extra hops in the trace. Align regions for a cleaner picture. |
| Run the Evals after each code change – It’s cheap (a few seconds) and catches regressions before they get to production. | Over‑instrumentation – Adding ActivitySource to every tiny helper method can flood your backend. Stick to high‑level boundaries (request → tool call → response). |
🚀 Wrap‑Up
With just a few commands you now have a fully observable playground that lets you:
- Swap models (local vs. hosted) without changing any business logic.
- Inspect tool‑call flows in both OpenAI’s native dashboard and Azure Monitor’s powerful KQL explorer.
- Quantify performance using the official OpenAI Evals suite, keeping the comparison apples‑to‑apples.
The repo is deliberately minimal—feel free to extend it with your own agents, custom exporters (Datadog, Honeycomb), or CI pipelines that run the Evals on every PR. The core idea is simple: observability is the glue that turns a sandbox experiment into a production‑grade workflow.
Happy tracing! 🚀