Debugging GenAI with NLWeb and OpenTelemetry: A Real-Time Visibility Win
We used NLWeb and OpenTelemetry to trace, debug, and query Copilot agent plugins — all in real-time.
🧠 Debugging GenAI with NLWeb and OpenTelemetry: A Real-Time Visibility Win

“If you can’t see it, you can’t debug it.”
That’s been the challenge with GenAI and Copilot-style plugins — until now.
🎯 Goal
I wanted to trace and troubleshoot my Copilot agent plugin activity using OpenTelemetry.
The stretch goal? Pipe that into a natural-language search experience using NLWeb,
so I could ask questions like:
- “What plugins were used?”
- “What calls failed?”
- “How long did token generation take?”
✅ As of today — we did it. Here’s how.
🔧 Setup Highlights
This project used:
- .NET 9 with
otelbetterto emit structured OpenTelemetry span logs - Aspire on Docker, running locally to collect traces
- NLWeb, modified to support our schema and allow prompt-based querying
- Qdrant, used as the vector database to store and retrieve span embeddings
We extended the OpenTelemetry exporter to emit this simplified schema:
{
  "@type": "Event",
  "Name": "InvokePrompt",
  "StartDate": "2025-05-21T19:06:53.0921720Z",
  "EndDate": "2025-05-21T19:06:56.2457840Z",
  "Location": "Copilot-Agent-Plugins",
  "Description": "user.prompt: do you know who fabian williams is...",
  "Identifier": "abc123xyz",
  "text": "InvokePrompt: user.prompt: do you know who fabian williams is",
  "url": "otel://InvokePrompt/abc123xyz",
  "name": "InvokePrompt - do you know who fabian williams is"
}
🔍 Plugin Call Analysis: Count, Duration, and Patterns
Once NLWeb was up and running, we tried a natural query:
“How many total calls were made for plugins, and what was the longest or shortest plugin time?”
Instead of returning a single metric, NLWeb gave us individual plugin span events.
Each event included precise start and end timestamps — useful for per-call inspection,
but not aggregated. This prompted a design reflection:
Should we enhance our OpenTelemetry schema to emit summary metrics like
duration_msorplugin_call_count? 🤔
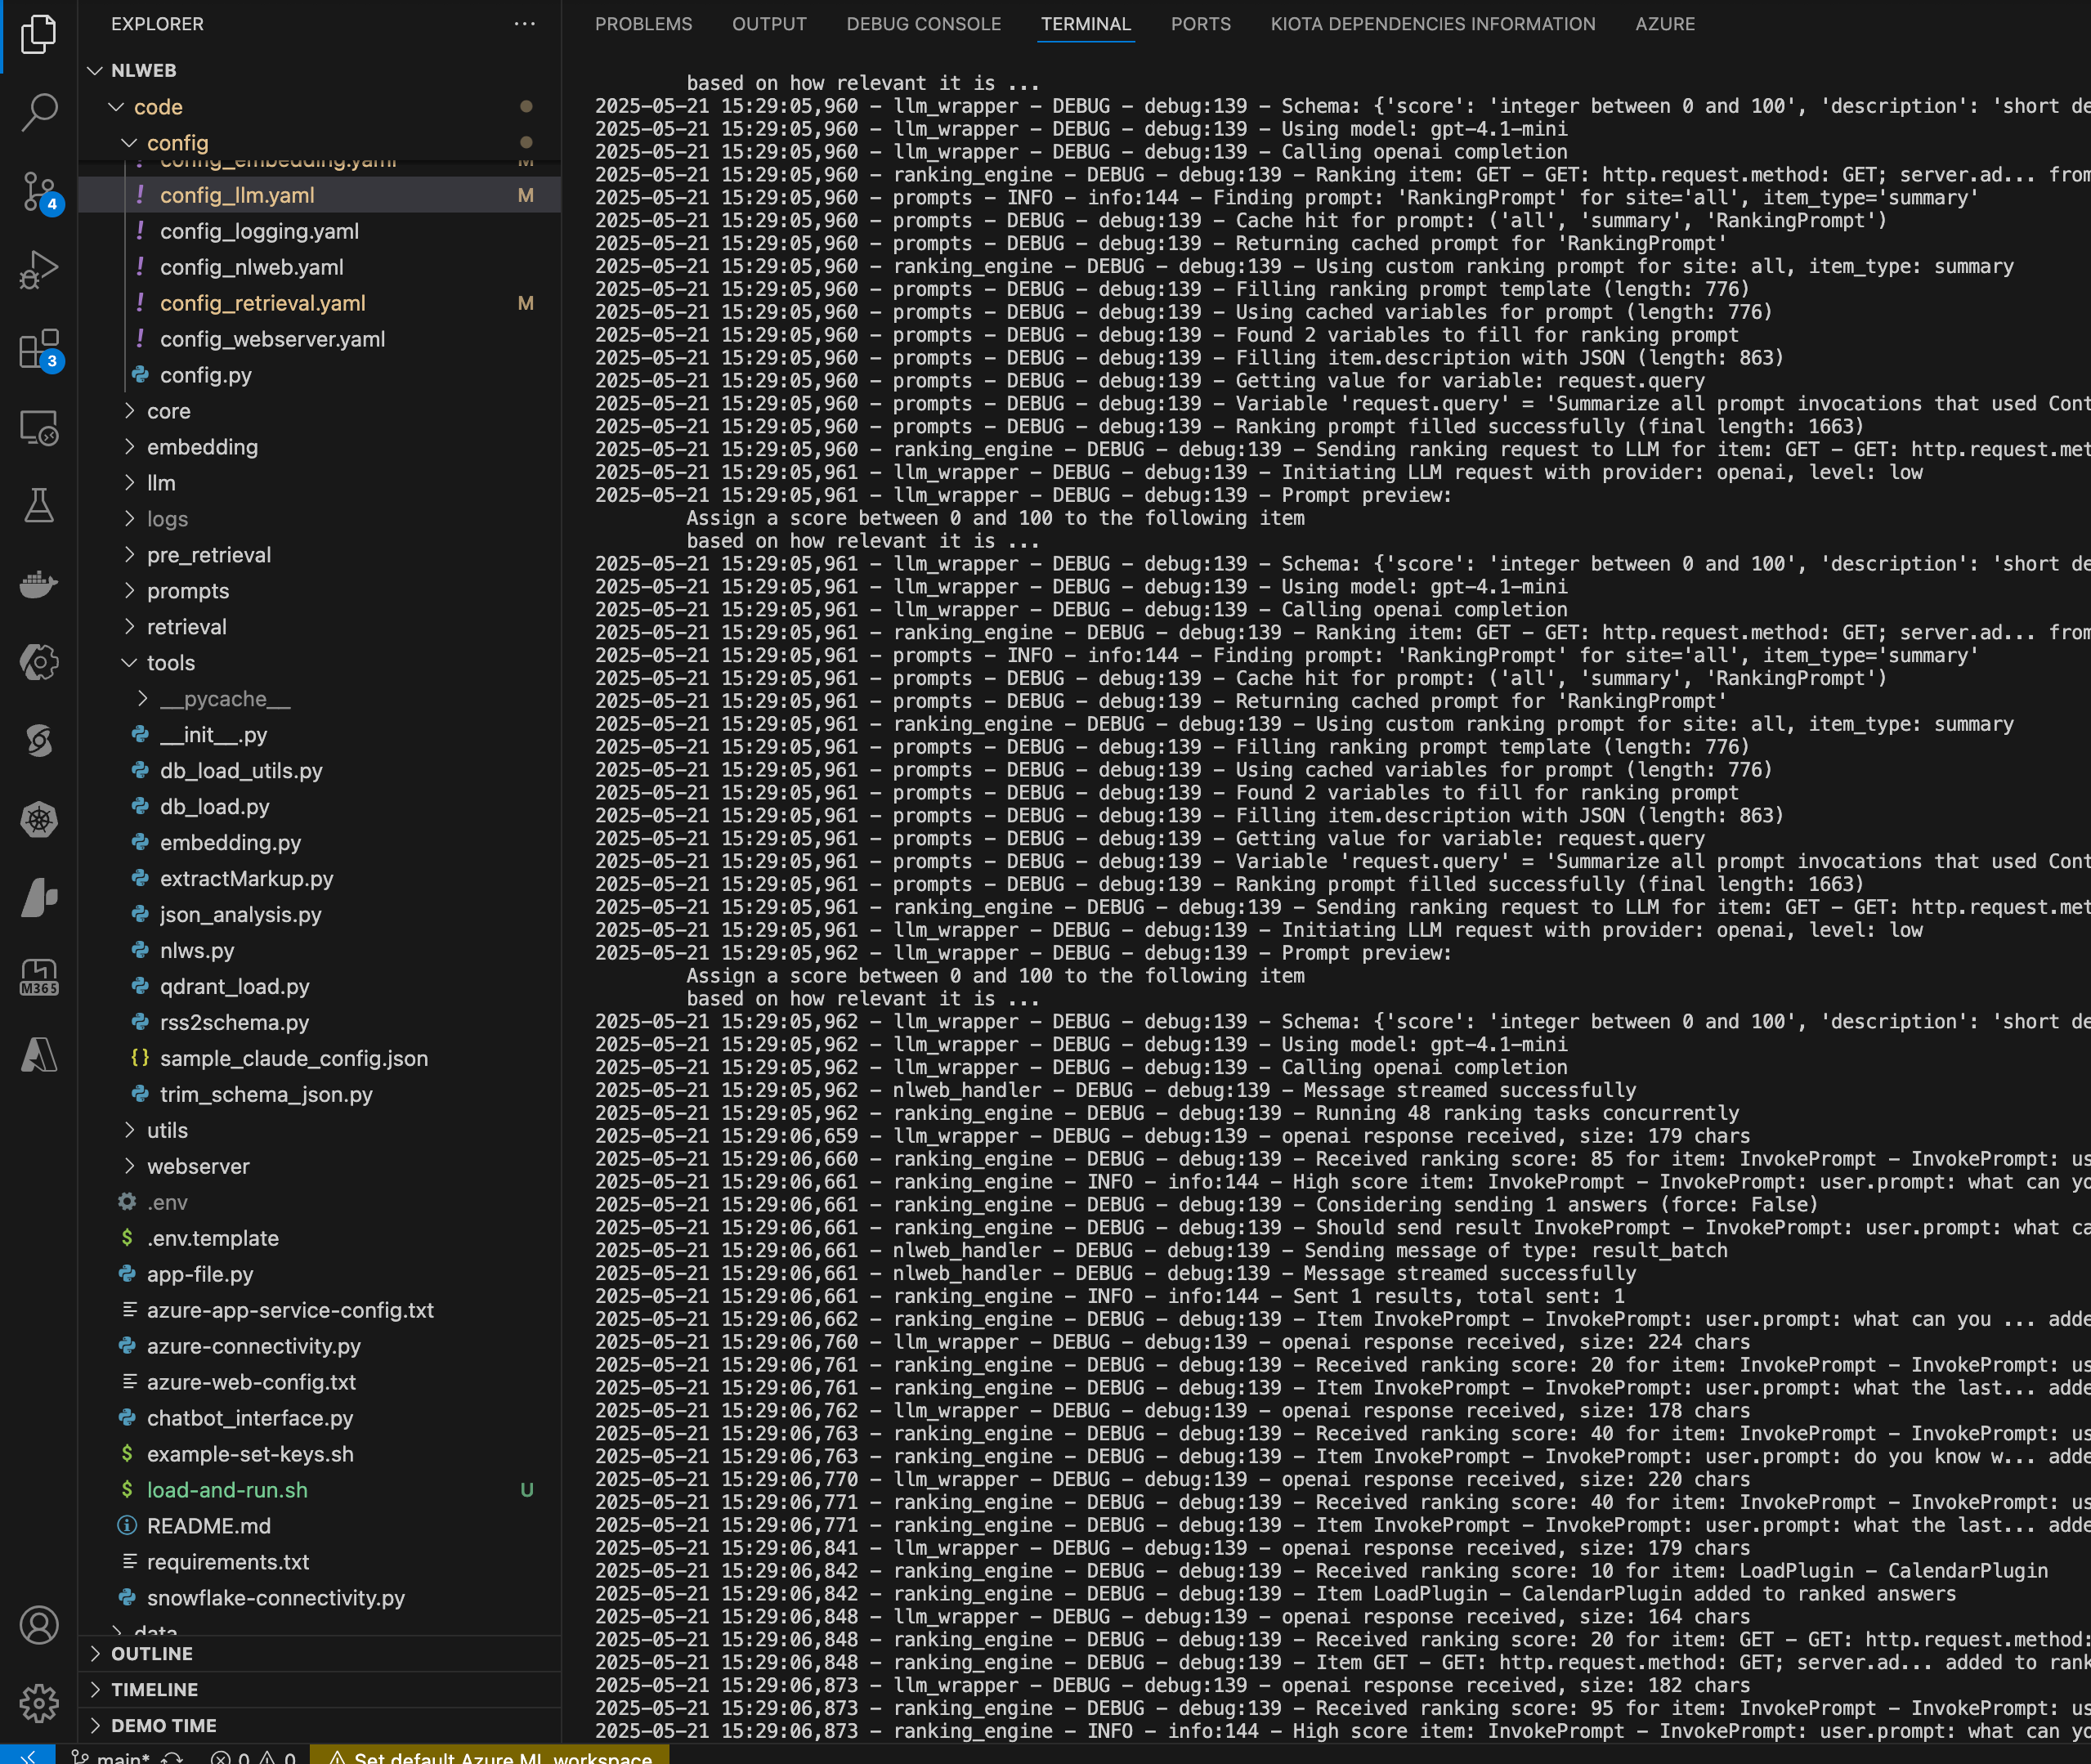
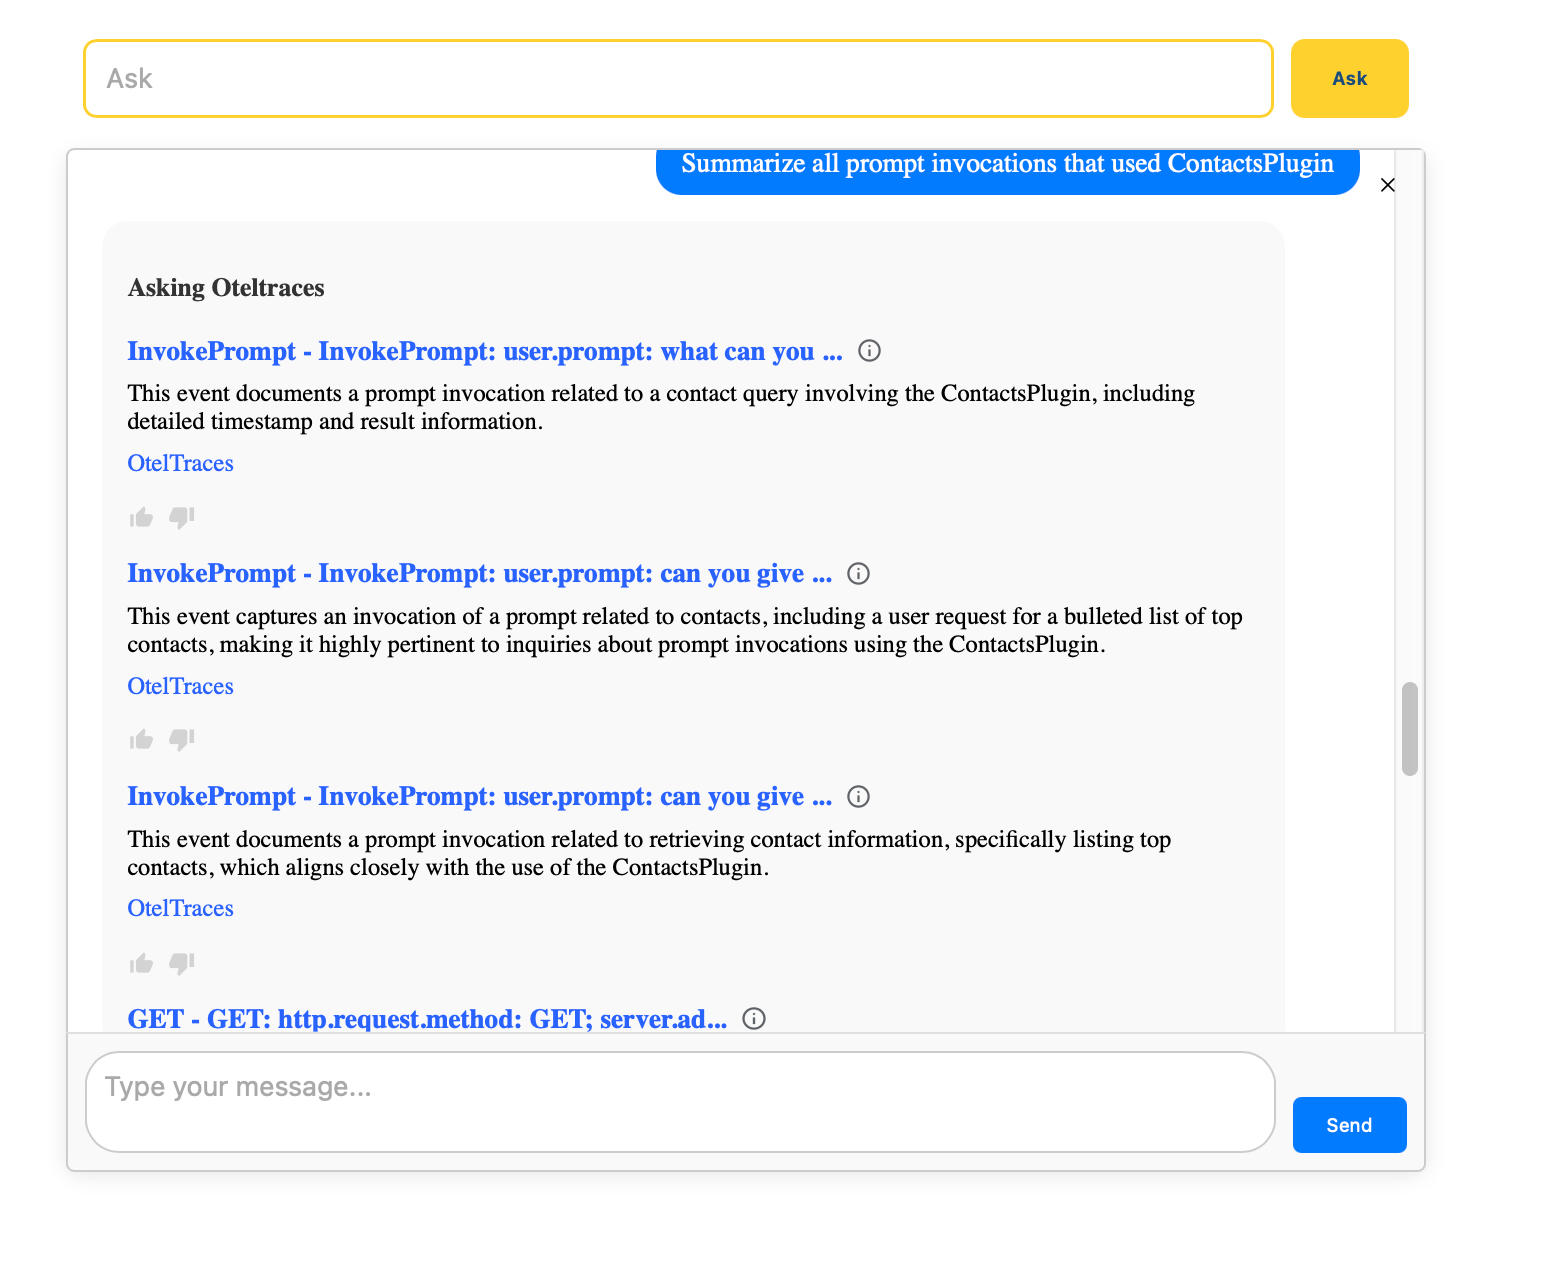
Here’s what the raw output looked like when asking about plugin durations:
So we scoped in further:
“How many times was the Contacts plugin called?”
This query performed better — thanks to consistent span naming and URL conventions.
We saw matches across both GET requests to Microsoft Graph and prompt invocations involving Contacts.
This kind of diagnostic transparency makes it clear:
While natural language queries are powerful, your trace schema must still support aggregate analysis.
🗂️ Step-by-Step Wins
✅ 1. Structured Export Format
We defined a clean SchemaEvent in C#:
private class SchemaEvent
{
    [JsonPropertyName("@type")]
    public string Type { get; set; } = "Event";

    public string Name { get; set; } = "";
    public string? StartDate { get; set; }
    public string? EndDate { get; set; }
    public string? Location { get; set; }
    public string? Description { get; set; }
    public string? Identifier { get; set; }

    [JsonPropertyName("text")]
    public string? Text { get; set; }
}
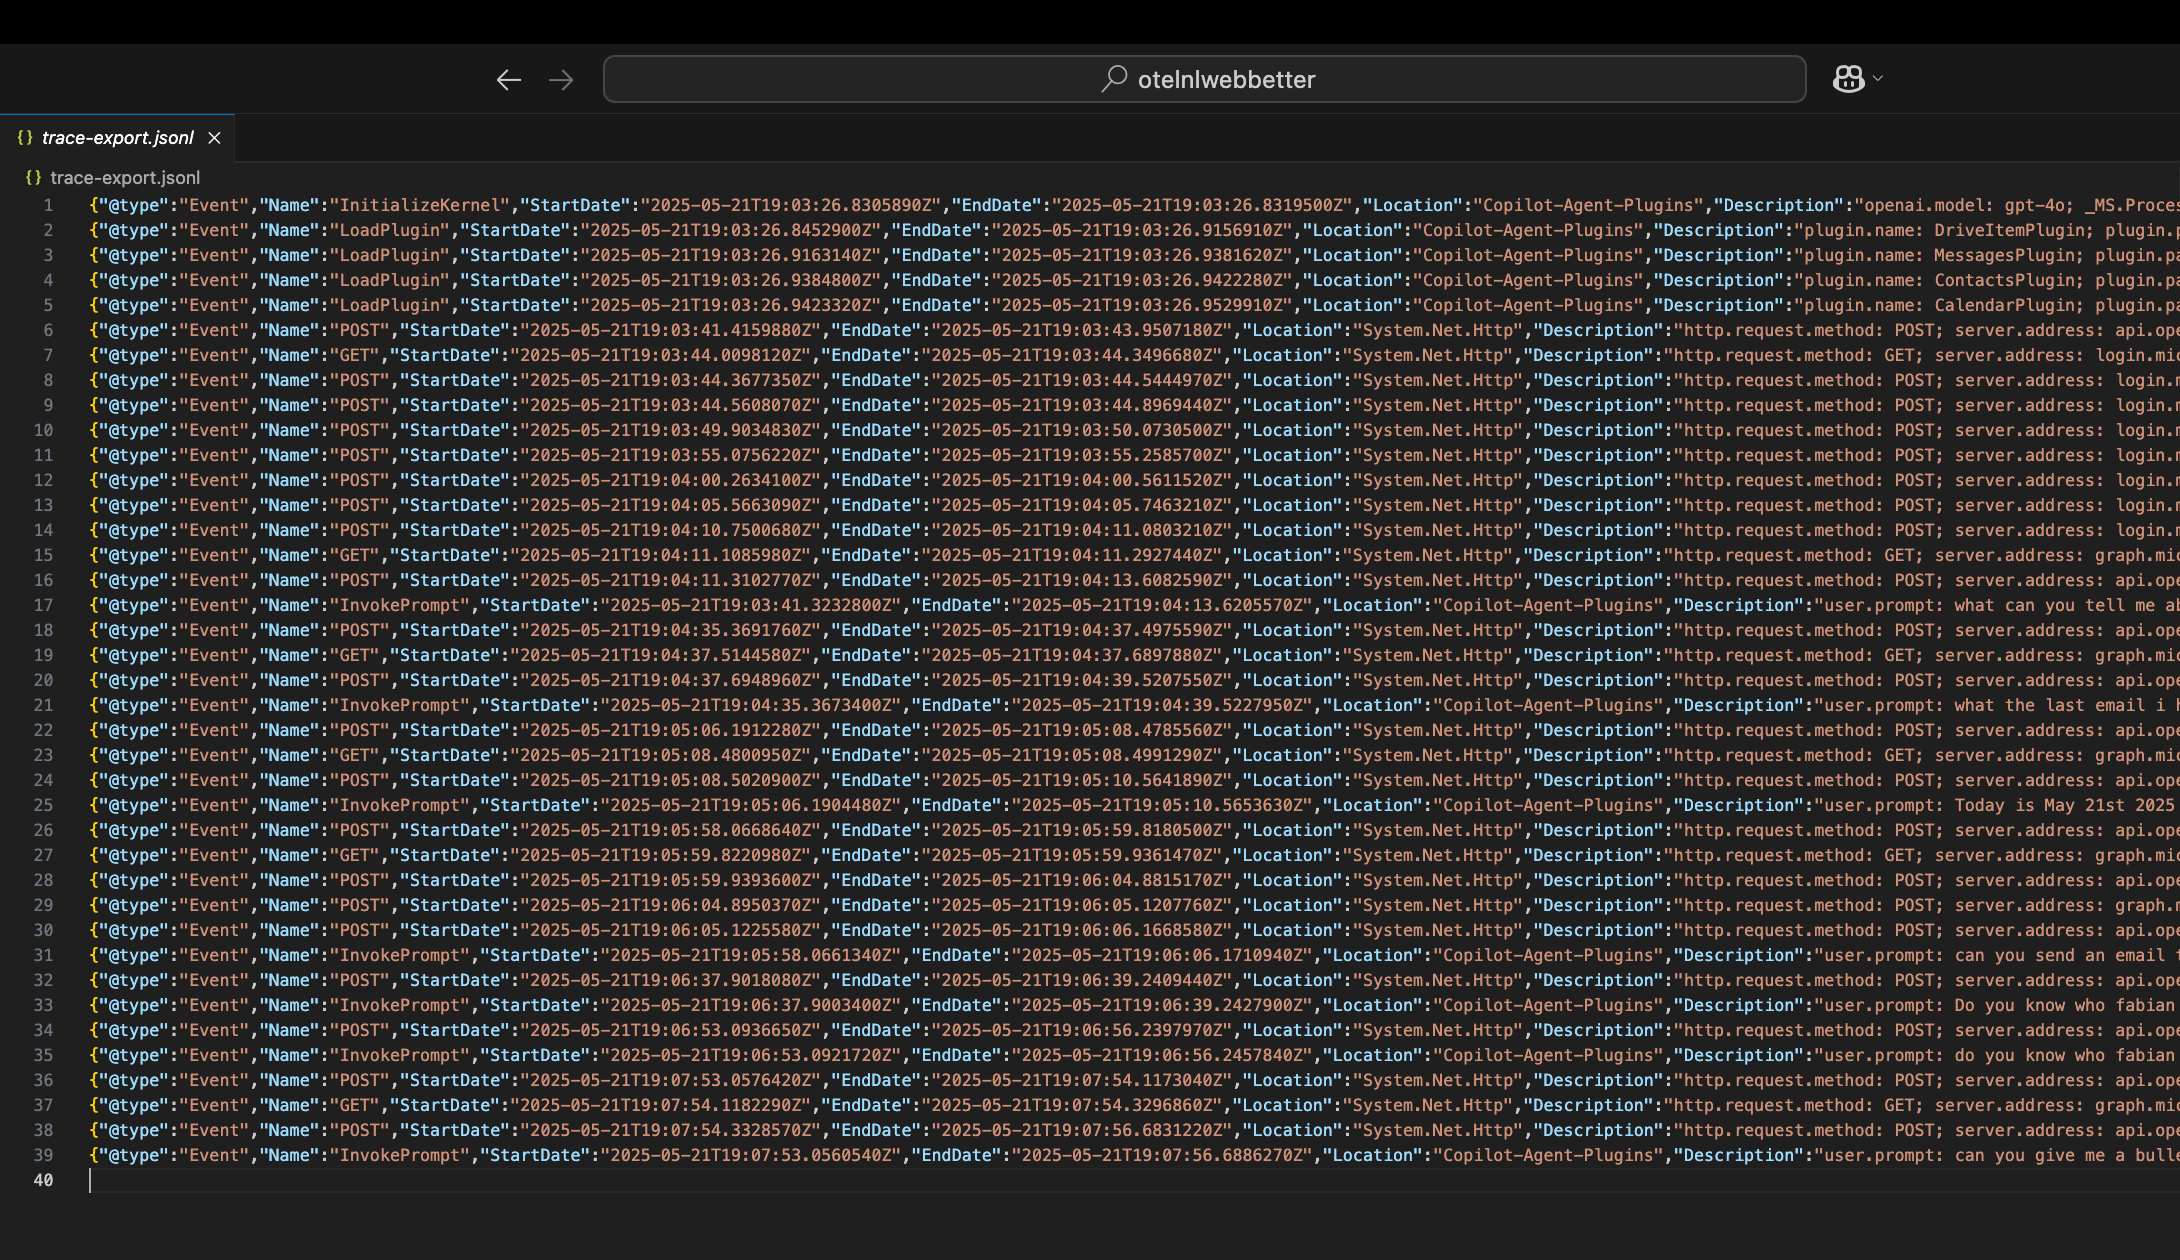
✅ 2. Verified File Format
We checked that trace-export.jsonl had the right format — each line was a valid JSON object.
✅ 3. Ran db_load.py
python -m tools.db_load /path/to/trace-export.jsonl OtelTraces
Console Output Confirmed:
- 39 documents embedded
- Qdrant collection created
- Data successfully uploaded
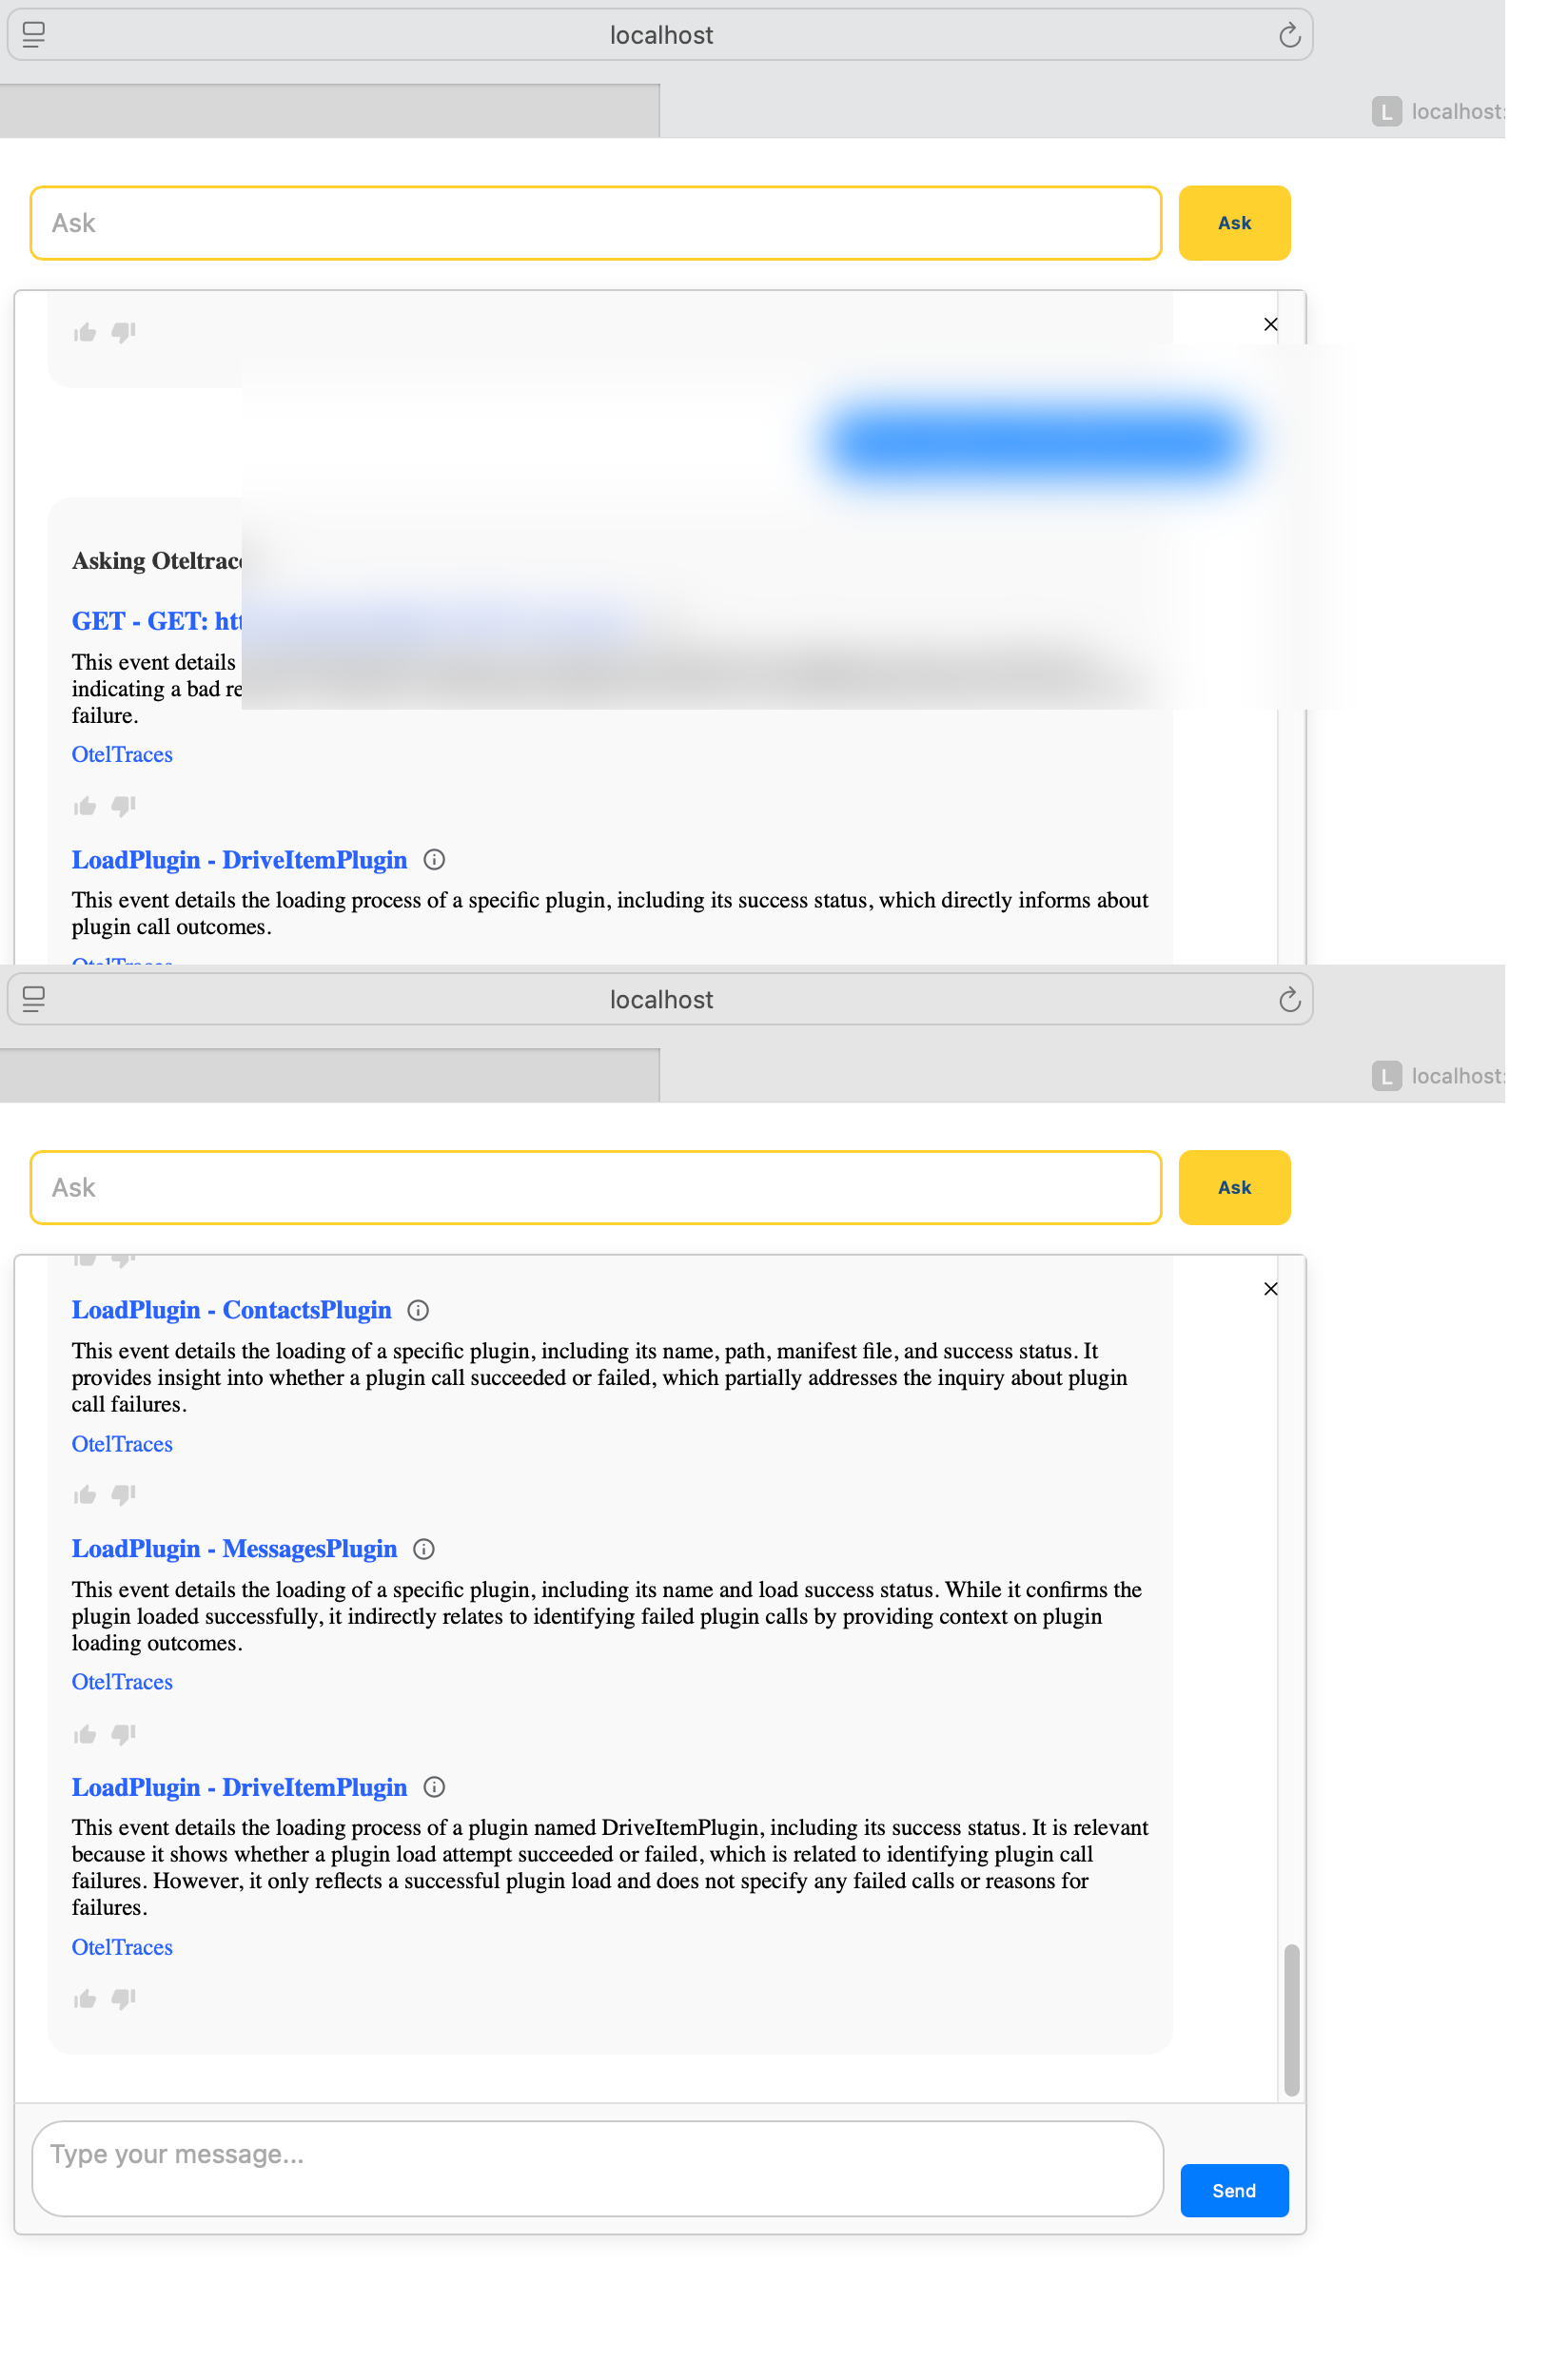
✅ 4. Queried NLWeb
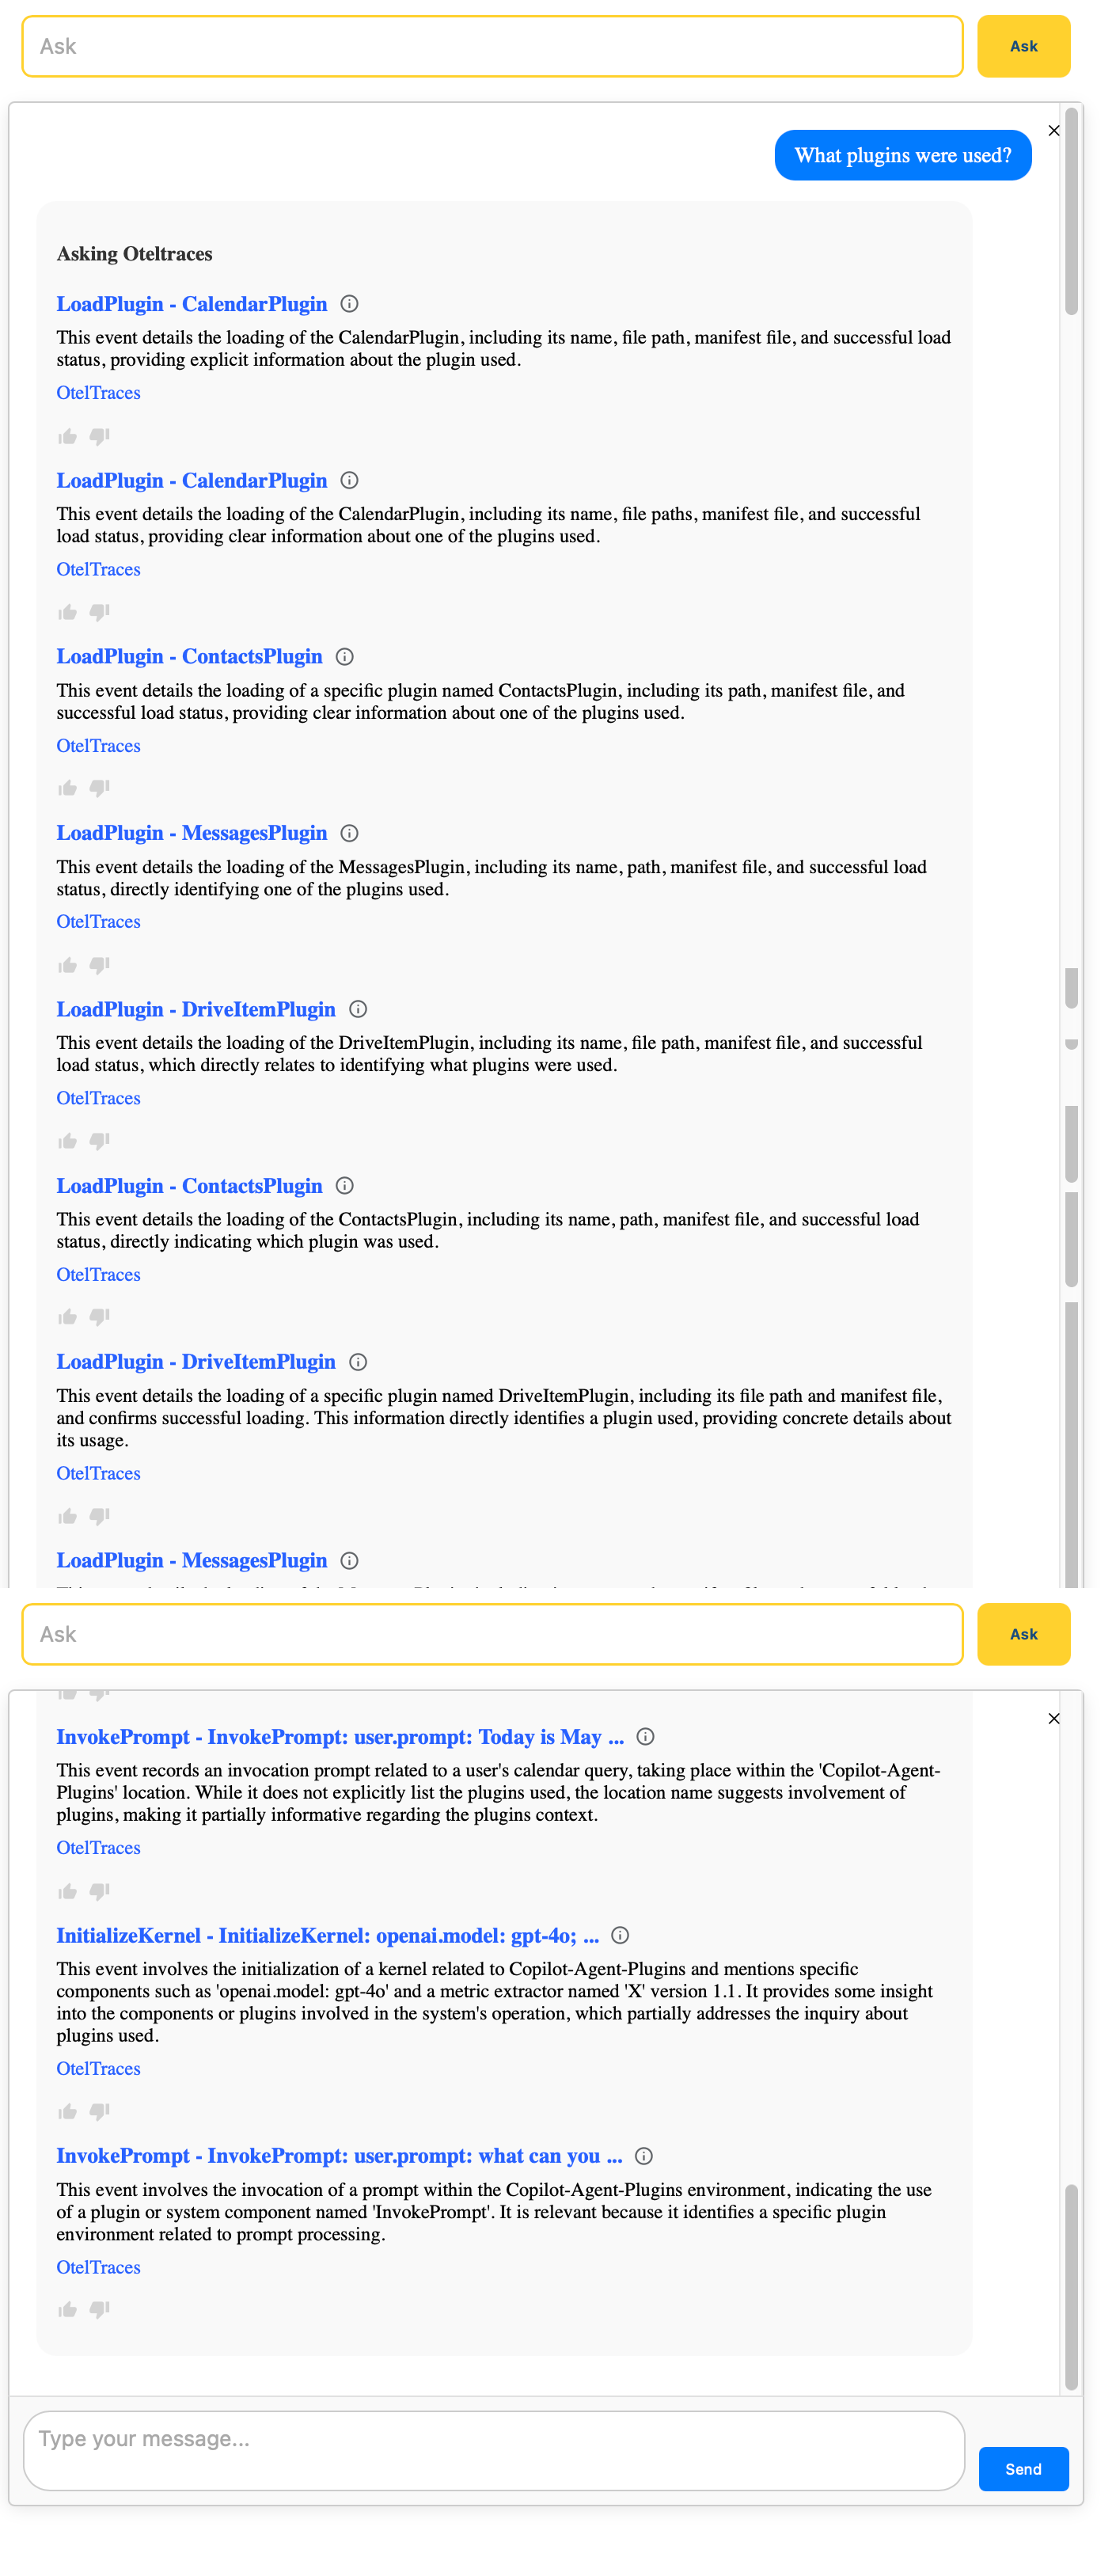
We hit the web UI and asked:
What plugins were used?
Boom 💥 — NLWeb:
- Used GPT to rank results semantically
- Pulled trace data with plugin load metadata
- Returned hoverable summaries
❌ Minor Glitch
At one point we hit this error: Missing required Azure OpenAI configuration
✅ Fix
Updated config_llm.yaml:
preferred_provider: openai # not azure_openai!
And ensured .env had:
OPENAI_API_KEY=sk-…
Now we’re using OpenAI directly with no dependency on Azure configuration.
📸 UI Polish (WIP)
- Would love clickable cards or expandable tooltips
- Long lines are currently cut off — wrapping will improve this
- But overall: it works, and we see traces in context
🔁 What’s Next
This is just the beginning.
- Add trend analytics over time
- Group queries by user or task
- Build alerting for error spans or failed HTTP calls
✍️ Wrapping Up
NLWeb + OpenTelemetry gave me real-time, queryable visibility into GenAI agent behavior.
Stay tuned for the full video breakdown 👀
In the meantime, I’ll be posting:
✅ This blog
✅ LinkedIn summary
✅ A follow-up on GitHub for broader use
Chat with me
| Engage with me | Click |
|---|---|
| BlueSky | @fabianwilliams |
| Fabian G. Williams |